
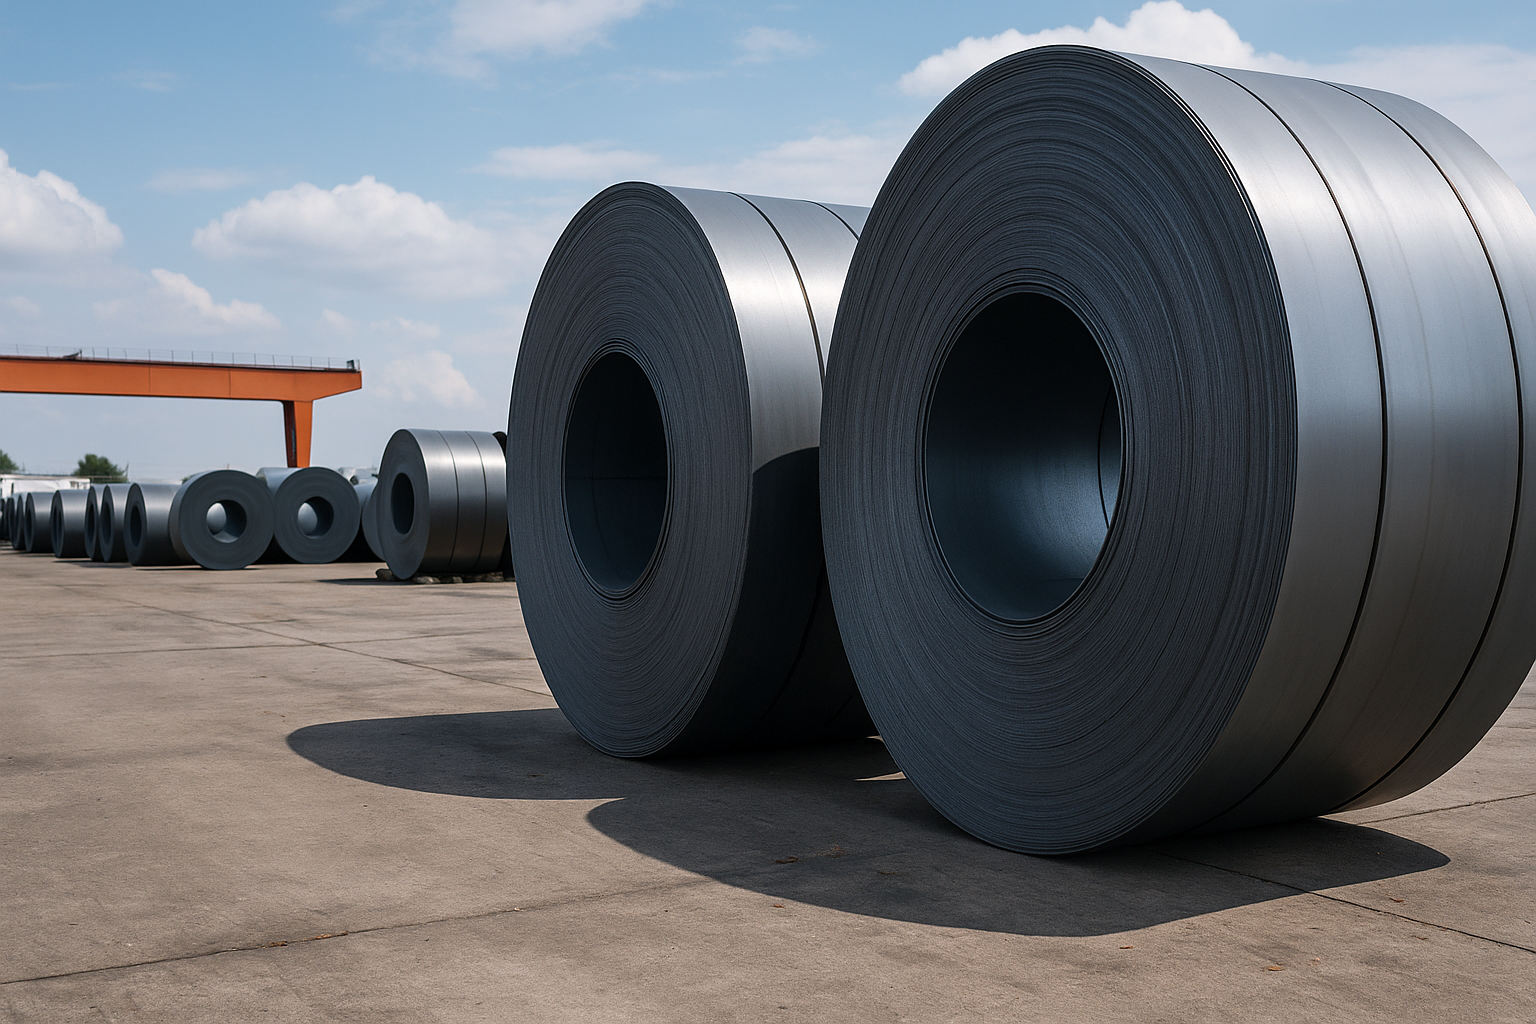
The global steel industry produces nearly two billion tonnes of crude steel every year, supplying the material base for construction, infrastructure, transportation, machinery, energy and manufacturing.
But global steel production is not distributed evenly.
A relatively small group of large steelmakers operates enormous production networks, while hundreds of regional and specialized producers compete across different products, technologies and geographic markets.
Understanding this structure requires more than ranking companies by size.
A company producing more crude steel is not automatically more profitable, technologically advanced, geographically diversified or commercially influential in every steel market.
This distinction is fundamental.
Steel industry leadership is multidimensional. Crude steel production measures industrial scale, but competitive position also depends on geography, product mix, technology, raw-material access, customer relationships, cost structure and market exposure.
This guide examines the world’s largest steel producers using the latest complete annual production data, explains how steel-company rankings should be interpreted and analyzes what production scale actually means for global competition.
1. How Should the World’s Largest Steel Companies Be Ranked?
There is no single universal measure of the “largest steel company.”
Companies can be ranked by:
- crude steel production;
- steelmaking capacity;
- finished steel shipments;
- revenue;
- market capitalization;
- assets;
- geographic footprint;
- specific product output.
Each metric answers a different question.
If the objective is to compare the physical scale of steelmaking operations, annual crude steel production is one of the most useful measures.
That is also the basis used by the World Steel Association in its global ranking of steel-producing companies.
For this article, company size therefore refers primarily to:
Annual Crude Steel Production — million tonnes (Mt)
unless another metric is explicitly identified.
2. Crude Steel Production Is Not the Same as Finished Steel Shipments
Crude steel is steel produced through primary steelmaking routes before subsequent rolling and finishing operations.
Finished products may include:
- hot-rolled coil;
- cold-rolled coil;
- galvanized sheet;
- plate;
- rebar;
- wire rod;
- structural sections;
- tubes.
A company can therefore produce one quantity of crude steel but report a different quantity of finished steel shipments.
Yield losses, internal transfers, semi-finished products, acquisitions and product mix can all affect the relationship.
This is why rankings should not combine crude-steel tonnage from one company with finished-product shipments from another.
The metric must be consistent.
3. Capacity Is Not Production
Another common mistake is to rank steelmakers using installed capacity as if it were actual production.
Consider a simplified example:
Company A
Installed capacity: 50 Mt
Actual production: 35 Mt
Company B
Installed capacity: 42 Mt
Actual production: 40 Mt
Company A has greater nominal capacity.
Company B produced more steel.
These are different measurements.
Capacity can indicate potential industrial scale, while production shows actual output during the period.
Capacity utilization therefore matters.
4. Revenue Is Also a Different Measure
Revenue depends on much more than tonnes produced.
Two steelmakers producing similar tonnage may generate very different revenues because they sell different products.
Higher-value portfolios may include:
- advanced high-strength steels;
- electrical steels;
- automotive sheet;
- stainless steel;
- specialty alloys;
- engineered plate.
Revenue can also include businesses outside conventional steelmaking.
Therefore:
Higher Revenue ≠ Higher Steel Production
and:
Higher Steel Production ≠ Higher Value per Tonne
Both metrics can be useful, but they should not be confused.
5. The Global Steel Industry Produced 1.849 Billion Tonnes in 2025
According to the World Steel Association, global crude steel production totaled approximately 1,848.9 million tonnes in 2025, compared with 1,886.8 Mt in 2024.
That represents a decline of roughly 2% year over year.
The geographic distribution is highly uneven.
The largest producing countries in 2025 were:
| Rank | Country | Crude steel production 2025 |
|---|---|---|
| 1 | China | 960.8 Mt |
| 2 | India | 164.9 Mt |
| 3 | United States | 81.9 Mt |
| 4 | Japan | 80.7 Mt |
| 5 | Russia | 67.9 Mt |
| 6 | South Korea | 62.2 Mt |
| 7 | Türkiye | 38.1 Mt |
| 8 | Germany | 34.1 Mt |
| 9 | Brazil | 33.4 Mt |
| 10 | Iran | 32.0 Mt |
China alone accounted for slightly more than half of global crude steel production in 2025.
That national concentration has major implications for the corporate structure of the industry.
6. The World’s Top 10 Steel-Producing Companies in 2025
The latest complete worldsteel ranking shows the following top ten producers:
| Rank | Company | 2025 crude steel production |
|---|---|---|
| 1 | China Baowu Group | 124.76 Mt |
| 2 | ArcelorMittal | 63.43 Mt |
| 3 | Nippon Steel Corporation | 57.78 Mt |
| 4 | Ansteel Group | 57.61 Mt |
| 5 | HBIS Group | 42.49 Mt |
| 6 | Shagang Group | 39.10 Mt |
| 7 | Jianlong Group | 38.02 Mt |
| 8 | POSCO Holdings | 37.36 Mt |
| 9 | Delong Steel | 32.03 Mt |
| 10 | Tata Steel Group | 30.46 Mt |
These figures represent crude steel production and follow worldsteel’s ownership and consolidation methodology.
That methodological qualification matters.
7. China Baowu Is the World’s Largest Steel Producer
China Baowu Group produced 124.76 Mt of crude steel in 2025, retaining the number-one position globally.
Its scale is remarkable.
Using worldsteel’s global production total, Baowu alone represented approximately 6.7% of global crude steel production in 2025.
That is enormous for a single corporate group.
But even this figure illustrates why the term “market share” needs careful interpretation.
Baowu’s share of:
- global crude steel production;
- Chinese steel production;
- automotive sheet;
- electrical steel;
- exports;
- a particular regional market;
would all be different.
Therefore, saying simply that Baowu has “6.7% global market share” would be imprecise.
The correct statement is:
Baowu produced approximately 6.7% of the world’s crude steel output in 2025.
8. ArcelorMittal Remains the Second-Largest Producer
ArcelorMittal produced 63.43 Mt of crude steel in 2025 according to worldsteel, ranking second globally.
Its competitive significance extends beyond tonnage.
Unlike many very large Chinese producers whose industrial base is heavily concentrated in China, ArcelorMittal has historically operated across multiple steel-consuming regions.
Geographic diversification can affect:
- customer proximity;
- currency exposure;
- trade barriers;
- logistics;
- energy costs;
- regional demand cycles.
Consequently, two companies with similar production volumes can have very different competitive profiles.
9. Nippon Steel Moved to Third Place in the 2025 Ranking
Nippon Steel Corporation reached 57.78 Mt in worldsteel’s 2025 ranking, placing it third globally.
The comparison with 2024 is particularly instructive.
In worldsteel’s 2024 ranking, Nippon Steel was fourth with 43.64 Mt.
The 2025 figure reflects worldsteel’s updated ownership structure. Its note states that Nippon Steel’s figure includes United States Steel Corporation, Sanyo Special Steel, Ovako, 40% of AM/NS India and 22% of USIMINAS.
This demonstrates an important rule:
A change in ranking can result from corporate consolidation as well as changes in physical output at existing plants.
Analysts should investigate both.
10. Ansteel Remains One of China’s Industrial Giants
Ansteel Group produced 57.61 Mt in 2025, almost equal to Nippon Steel’s consolidated figure.
The difference between third and fourth place was therefore only about 0.17 Mt.
This illustrates another problem with rankings.
A small change in production, ownership scope or reporting methodology can change positions without materially changing the competitive structure of the industry.
The ranking number should not be overinterpreted.
11. HBIS, Shagang and Jianlong Reinforce China’s Corporate Scale
Three additional Chinese groups occupy positions five through seven:
- HBIS Group — 42.49 Mt;
- Shagang Group — 39.10 Mt;
- Jianlong Group — 38.02 Mt.
Their presence demonstrates how China’s national production dominance translates into corporate representation among the world’s largest steelmakers.
China produced 960.8 Mt of crude steel in 2025—more than five times India’s output, despite India being the world’s second-largest producing country.
Corporate rankings therefore cannot be understood independently from national industry structure.
12. POSCO Remains a Major Global Producer
POSCO Holdings ranked eighth with 37.36 Mt in 2025.
South Korea itself produced 62.2 Mt during the year.
This illustrates a different national structure.
A very large producer can represent a substantial portion of the steelmaking scale of a country while competing internationally through product quality, manufacturing capability and integration with major industrial customers.
For market intelligence, corporate scale should therefore be analyzed together with the producer’s role inside its domestic industrial ecosystem.
13. Delong Steel Entered the Global Top Ten
Delong Steel ranked ninth in 2025 with 32.03 Mt, up from 29.33 Mt and 11th place in the 2024 worldsteel ranking.
This is a meaningful example of why the ranking should be updated annually.
Steel-company positions are not static.
They change through:
- production variation;
- acquisitions;
- consolidation;
- divestments;
- plant closures;
- new capacity;
- ownership changes.
A “Top Steel Companies” article without a clearly stated data year becomes obsolete quickly.
14. Tata Steel Completes the Top Ten
Tata Steel Group ranked tenth with 30.46 Mt of crude steel production in 2025.
India’s broader position is especially important.
India produced 164.9 Mt in 2025, up from 149.4 Mt in 2024, reinforcing its position as the world’s second-largest steel-producing country.
The country also has several large corporate producers.
Immediately below Tata Steel in the global ranking were:
- JSW Steel — 30.28 Mt;
- SAIL — 19.44 Mt.
This creates an increasingly important Indian corporate cluster within global steelmaking.
15. The Top 10 Produce About 28% of Global Crude Steel
Adding the production of the ten largest companies produces approximately:
523 Mt of crude steel
against global production of approximately:
1,848.9 Mt
That means the ten largest corporate groups represented approximately 28% of world crude steel output in 2025, based on the worldsteel figures.
This result is strategically interesting.
The industry contains enormous companies, but global corporate production is not concentrated into only a handful of firms.
Compare this with China’s geographic concentration: one country produced slightly more than half of global crude steel, while the ten largest corporate groups together produced only about 28%.
This apparent paradox results partly from China’s fragmented corporate structure despite years of consolidation.
16. Geographic Concentration and Corporate Concentration Are Different
This distinction deserves emphasis.
Global steel production can be:
highly concentrated geographically
while simultaneously being:
less concentrated at the corporate level.
China illustrates this clearly.
It dominates global crude steel production geographically, but that production is distributed across multiple major groups.
Therefore, an analyst should separately measure:
- country concentration;
- corporate concentration;
- regional concentration;
- product concentration.
They answer different strategic questions.
17. Why “Global Market Share” Can Be Misleading
Suppose a company produces 5% of global crude steel.
Does it have 5% of the global steel market?
Not necessarily.
The answer depends on what “market” means.
Possible denominators include:
- crude steel production;
- finished steel consumption;
- steel revenue;
- export volume;
- flat products;
- long products;
- automotive steel;
- stainless steel;
- electrical steel;
- regional sales.
A technically rigorous article should therefore avoid presenting an undefined “market share.”
Instead, state the metric explicitly.
For example:
Share of Global Crude Steel Production
is defensible.
Global Steel Market Share
without qualification may not be.
18. Corporate Ownership Rules Affect Rankings
worldsteel applies defined rules when consolidating company production.
For member-company declarations, more than 50% ownership generally results in 100% of subsidiary tonnage being included unless otherwise specified; holdings between 30% and 50% are generally included proportionally; minority holdings below 30% are generally excluded unless otherwise specified. The 2025 figures reflect ownership at year-end 2025.
This means corporate rankings are not merely plant-production tables.
They are consolidated corporate statistics.
When comparing rankings across years, analysts should therefore ask:
Did production change, or did consolidation scope change?
19. Mergers and Acquisitions Can Reshape the Ranking Quickly
Steelmaking is capital intensive.
Large industrial combinations can immediately alter corporate rankings.
Acquisitions can provide:
- production capacity;
- new geographic markets;
- customer relationships;
- technology;
- raw-material access;
- downstream facilities.
But greater consolidated tonnage does not automatically create proportional competitive advantage.
Integration quality matters.
So do:
- asset condition;
- cost position;
- product mix;
- utilization;
- labor productivity;
- energy costs.
Size is only the starting point.
20. Steel Industry Consolidation Has Strategic Objectives
Consolidation can be driven by several motives.
Scale
Larger groups may spread corporate functions and technology investment across more production.
Market Position
Acquisitions can strengthen bargaining power or regional presence.
Product Portfolio
A producer can acquire capabilities it does not currently possess.
Geographic Diversification
International assets can reduce dependence on one national market.
Capacity Rationalization
Consolidation may facilitate restructuring of inefficient assets.
Decarbonization
Large capital requirements for low-carbon steelmaking can increase the strategic value of financial and technological scale.
But none of these benefits is automatic.
21. Production Scale Can Create Economies—but Not Everywhere
Steelmaking includes operations where scale can be economically important.
Large integrated sites may benefit from:
- high-capacity furnaces;
- shared infrastructure;
- raw-material logistics;
- energy integration;
- large rolling facilities;
- centralized maintenance.
Corporate scale can also support:
- R&D;
- procurement;
- digital systems;
- engineering;
- global sales.
However, steel markets remain regional in many products because freight and trade barriers matter.
A smaller regional producer located close to customers can outperform a larger distant competitor in a specific market.
22. Product Mix Can Matter More Than Tonnage
Consider two hypothetical companies.
Producer A
40 Mt commodity steel.
Producer B
20 Mt highly specialized steels.
Producer A is twice as large by crude steel production.
But Producer B may achieve:
- higher value per tonne;
- stronger customer integration;
- higher switching costs;
- greater technical differentiation.
Therefore:
Tonnage measures scale—not necessarily value creation.
This distinction is essential when analyzing advanced steel producers.
23. Flat and Long Steel Markets Have Different Competitive Structures
Steel is not one homogeneous product market.
Flat Products
Examples:
- hot-rolled coil;
- cold-rolled coil;
- coated sheet;
- plate.
Major customers include automotive, appliances, machinery, energy and construction.
Long Products
Examples:
- rebar;
- wire rod;
- sections;
- merchant bar.
Construction and infrastructure often dominate demand.
A company strong in flat products may have limited relevance to a buyer sourcing rebar.
A large long-products producer may not be a meaningful supplier of automotive sheet.
Company scale must therefore be connected to product capability.
24. Specialty Steel Creates Another Competitive Dimension
Some companies compete through specialty products rather than maximum tonnage.
Examples include:
- stainless steel;
- tool steel;
- electrical steel;
- bearing steel;
- high-strength grades;
- corrosion-resistant alloys.
In these markets, competitive advantage may depend on:
- metallurgy;
- process control;
- surface quality;
- tolerances;
- certification;
- customer qualification.
A global crude-steel ranking can therefore understate the strategic importance of specialized producers.
25. Technology Route Also Shapes Competitive Position
Steelmakers do not all use the same production route.
Major routes include:
Blast Furnace → Basic Oxygen Furnace (BF-BOF)
and:
Electric Arc Furnace (EAF)
with DRI-based configurations also playing an important role in some regions.
These routes differ in:
- raw-material requirements;
- energy use;
- scrap dependence;
- capital intensity;
- emissions profile;
- operating flexibility.
The production route can therefore affect competitive position independently of corporate size.
26. Raw-Material Integration Can Be a Strategic Advantage
Steel production depends on inputs such as:
- iron ore;
- metallurgical coal;
- scrap;
- ferroalloys;
- electricity;
- natural gas.
Some steel groups own or control portions of their raw-material supply.
Others depend heavily on external procurement.
Vertical integration can provide:
- supply security;
- cost visibility;
- quality control.
But it also increases capital requirements and exposure to raw-material cycles.
The optimal structure depends on geography and production route.
27. Energy Has Become a Major Competitive Variable
Energy costs influence:
- EAF economics;
- DRI production;
- reheating;
- rolling;
- finishing;
- auxiliary systems.
As steel decarbonization progresses, access to competitive low-carbon electricity and hydrogen-related infrastructure may become increasingly important.
Future leadership may therefore depend not only on existing steel capacity but also on access to the energy systems required for new production routes.
For a detailed technology comparison, see Green Steel Technologies: An Engineering Guide to Low-Carbon Steel Production.
28. Decarbonization Is Increasing the Importance of Capital Strength
Conventional steel assets already require large investments.
Low-carbon transformation can require additional investment in:
- EAF capacity;
- DRI plants;
- hydrogen infrastructure;
- renewable power;
- grid connections;
- carbon capture;
- new raw-material preparation.
Large steel groups may have advantages in financing, engineering resources and technology partnerships.
But legacy assets can also create transition challenges.
Scale can therefore be both an advantage and a burden.
29. China Dominates the Corporate Ranking
Among the top ten producers in 2025, six were Chinese groups:
- China Baowu;
- Ansteel;
- HBIS;
- Shagang;
- Jianlong;
- Delong.
Shougang, Jingye, Hunan Steel and several other Chinese producers also appear further down the top 50.
This reflects China’s extraordinary production scale.
For a broader explanation of China’s influence on international steel markets, see How China Influences Global Steel Prices.
Corporate rankings should therefore be interpreted within the larger Chinese supply-demand system.
30. India’s Position Is Strengthening
India’s crude steel production increased from 149.4 Mt in 2024 to 164.9 Mt in 2025, an increase of more than 10% according to worldsteel’s figures.
At the corporate level:
- Tata Steel ranked 10th;
- JSW Steel ranked 11th;
- SAIL ranked 18th.
This combination of national growth and large domestic producers makes India strategically important in long-term steel-market analysis.
The direction contrasts with several mature steel-producing economies where production has been stable or declining.
31. Japan Remains Important Despite Lower National Production
Japan produced 80.7 Mt in 2025, down from 84.0 Mt in 2024.
Yet Japan retains major globally significant producers.
Nippon Steel ranked third and JFE Steel ranked 14th.
This illustrates why national production trends and corporate competitiveness must be analyzed separately.
A mature domestic market can still contain globally important producers with:
- advanced technology;
- international assets;
- specialized products;
- demanding customer relationships.
32. South Korea Has Large Producers Relative to National Output
South Korea produced 62.2 Mt in 2025.
POSCO Holdings produced 37.36 Mt according to the corporate ranking, while Hyundai Steel produced 17.95 Mt.
Together, these figures demonstrate a relatively concentrated corporate structure compared with countries containing many independent steel groups.
Again, country concentration and corporate concentration are separate analytical dimensions.
33. The United States Has a Distinct Industry Structure
The United States produced 81.9 Mt of crude steel in 2025, moving ahead of Japan to become the world’s third-largest producing country.
Major U.S.-based producers in the worldsteel ranking include:
- Nucor — 22.33 Mt;
- Cleveland-Cliffs — 17.06 Mt;
- Steel Dynamics — 10.70 Mt.
United States Steel no longer appears as a separate company in the 2025 ranking because its production is included in Nippon Steel’s consolidated figure under worldsteel’s methodology.
This is precisely why rankings must be read together with ownership notes.
34. Brazil Remains a Top-Ten Steel-Producing Country
Brazil produced 33.4 Mt of crude steel in 2025 and ranked ninth globally.
Gerdau ranked 31st among global corporate producers with 13.03 Mt.
The Techint Group ranked 24th with 16.30 Mt, with worldsteel noting that its figure includes USIMINAS.
Brazil’s competitive relevance also involves:
- iron ore availability;
- domestic industrial demand;
- export markets;
- flat and long product structures;
- regional Latin American integration.
Country rankings alone cannot capture these characteristics.
35. Europe Should Not Be Treated as One Corporate Market
European steel production is distributed across several countries and companies.
Germany produced 34.1 Mt in 2025, while Italy produced 20.7 Mt and France 9.9 Mt.
Corporate groups may operate assets across national borders.
Consequently, three geographic concepts should be distinguished:
Headquarters Location
Plant Location
Sales Market
A company headquartered in one country may manufacture and sell steel across several others.
This matters for trade, energy and regulatory analysis.
36. Headquarters Does Not Define Production Origin
This distinction is especially important for sourcing.
A multinational steel company may have plants in multiple countries.
Buying from that company does not automatically identify the country of origin of the steel.
The relevant questions include:
- Which mill produced the material?
- In which country?
- What manufacturing route was used?
- What certificate identifies the heat?
- What origin rules apply?
Corporate identity is not a substitute for mill-origin verification.
37. Large Steelmakers Are Often Portfolios of Different Assets
A global steel group may contain:
- integrated BF-BOF mills;
- EAF mini-mills;
- rolling-only facilities;
- coating lines;
- service centers;
- mining assets;
- scrap operations;
- distribution businesses.
Therefore, “Company X produces 50 Mt” does not mean every facility within the group has the same:
- cost structure;
- technology;
- quality capability;
- emissions intensity;
- product range.
Corporate averages can hide major asset-level differences.
38. Plant-Level Analysis Is Essential for Procurement
For a buyer, the relevant unit of analysis is often not the corporate group.
It is the qualified manufacturing mill.
Suppose a global producer operates ten mills.
Only two may manufacture the required:
- grade;
- width;
- thickness;
- coating;
- standard.
The sourcing sequence should therefore be:
Corporate Screening → Mill Identification → Product Capability → Technical Qualification → Commercial Evaluation
not simply:
Largest Company → Preferred Supplier
39. Scale Can Improve Procurement Power
Large steelmakers purchase enormous quantities of:
- ore;
- coal;
- scrap;
- alloys;
- electrodes;
- refractories;
- industrial gases;
- energy;
- logistics.
Scale may improve bargaining power.
It can also support long-term supply contracts and infrastructure investments.
However, raw-material advantage varies by region and production route.
A global tonnage ranking does not reveal procurement cost directly.
40. Scale Can Support Research and Development
Large producers may invest in:
- advanced metallurgy;
- digital process control;
- new coatings;
- high-strength steel;
- electrical steel;
- hydrogen-based ironmaking;
- carbon capture;
- automation.
But innovation intensity cannot be inferred from production tonnage alone.
A smaller specialized producer may be more technologically advanced within a narrow product segment.
Therefore:
Industrial Scale ≠ Innovation Leadership
although the two can coexist.
41. Customer Qualification Creates Competitive Barriers
In technically demanding markets, steel suppliers may require lengthy customer qualification.
Examples include:
- automotive;
- energy;
- pressure equipment;
- critical structural applications.
Qualification can involve:
- chemistry;
- mechanical properties;
- surface quality;
- dimensional capability;
- forming performance;
- weldability;
- traceability.
Once qualified, supplier relationships can become relatively sticky.
This creates competitive advantages not visible in crude-steel production rankings.
42. Logistics Can Limit the Advantage of Global Scale
Steel is heavy and relatively expensive to transport compared with its unit value.
Logistics therefore influence the effective competitive radius of a plant.
Relevant variables include:
- mill-to-port distance;
- port infrastructure;
- vessel availability;
- ocean freight;
- inland transportation;
- handling;
- inventory.
A global producer may be less competitive in a particular destination than a smaller regional producer located closer to the customer.
43. Trade Barriers Can Fragment Global Competition
Steel is frequently affected by:
- tariffs;
- anti-dumping measures;
- countervailing duties;
- safeguards;
- quotas;
- local-content policies;
- carbon-related trade mechanisms.
These measures can change competitive relationships dramatically.
A producer with low mill cost may become uncompetitive after duties.
A regional producer may gain protection from imports.
Therefore, global production scale does not translate automatically into unrestricted global market access.
44. Exports Are a Different Ranking
The largest steel producer is not necessarily the largest steel exporter.
A producer may sell most output domestically.
Another may be heavily export-oriented.
Likewise, the largest producing country is not necessarily proportionally the largest exporter for every product category.
For trade analysis, use actual trade-flow data.
For methodology, see Steel Import and Export Data Analysis: A Practical Guide for Market Intelligence.
Do not infer export leadership from crude steel production alone.
45. Apparent Steel Use Adds the Demand Side
Production tells us where steel is made.
Apparent steel use helps indicate where steel is consumed.
The interaction between:
Production → Domestic Demand → Imports → Exports
is central to steel-market analysis.
A country with high production and weak domestic demand may exert greater pressure on export markets.
A rapidly growing consuming market may absorb increasing domestic production.
For a broader framework, see Key Indicators for Understanding the Global Steel Market.
46. Excess Capacity Can Change Competitive Behavior
Installed steelmaking capacity can exceed effective demand.
When utilization falls, producers may face pressure to:
- reduce output;
- lower prices;
- increase exports;
- restructure assets;
- close capacity.
This can intensify international competition.
Therefore, production rankings should be analyzed alongside:
- demand;
- utilization;
- capacity;
- trade flows.
A company ranking is a snapshot.
Market structure is dynamic.
47. Company Rank Does Not Measure Financial Health
A company can produce enormous tonnage and still face weak profitability.
Financial performance depends on:
- steel spreads;
- raw-material costs;
- energy;
- labor;
- utilization;
- product mix;
- debt;
- capital expenditure;
- regional pricing.
Consequently:
Production Rank ≠ Profitability Rank
Financial analysis requires separate indicators.
48. Company Rank Does Not Measure Environmental Performance
Likewise, crude-steel tonnage says nothing directly about:
- CO₂ intensity;
- energy efficiency;
- recycled content;
- renewable electricity;
- water performance.
A smaller producer using an efficient scrap-EAF route may have a very different emissions profile from a large integrated BF-BOF producer.
Environmental comparisons require normalized metrics such as emissions per tonne and clearly defined system boundaries.
49. Company Rank Does Not Measure Product Quality
There is no general rule that the largest producer makes the highest-quality steel.
Quality depends on:
- process capability;
- metallurgy;
- equipment;
- quality systems;
- customer requirements;
- specific mill performance.
Procurement should therefore never use corporate size as a substitute for technical qualification.
50. How to Evaluate a Steel Producer Beyond Tonnage
A more complete framework includes at least eight dimensions.
1. Industrial Scale
Crude steel production and capacity.
2. Product Capability
Grades, dimensions and finishing capabilities.
3. Geographic Position
Plant locations and target markets.
4. Cost Position
Raw materials, energy, labor and logistics.
5. Technology
Production route, automation and metallurgy.
6. Commercial Position
Customer base, contracts and distribution.
7. Financial Capacity
Ability to invest and withstand cycles.
8. Transition Readiness
Capability to adapt to decarbonization and regulatory change.
This produces a much richer competitive picture.
51. A Practical Competitive-Position Matrix
A market-intelligence team can build a matrix such as:
| Dimension | Question |
|---|---|
| Crude steel output | How large is the producer? |
| Capacity utilization | How intensively are assets being used? |
| Product mix | Commodity or differentiated? |
| Geography | Where are the mills? |
| Raw materials | Integrated or externally dependent? |
| Technology route | BF-BOF, EAF, DRI or mixed? |
| Export exposure | How dependent is the company on foreign markets? |
| Customer sectors | Construction, automotive, energy, machinery? |
| Decarbonization | What transition investments are underway? |
| Financial strength | Can the company fund major modernization? |
The purpose is not to create a universal score.
It is to prevent tonnage from becoming the only variable.
52. How Buyers Should Use Global Producer Rankings
For procurement, rankings are useful for screening.
They can help identify:
- major industrial groups;
- countries with substantial production;
- potential alternative supply regions;
- corporate consolidation.
But they cannot confirm:
- exact product availability;
- mill origin;
- MOQ;
- lead time;
- certification;
- price;
- trade-remedy exposure.
Therefore:
Ranking → Research → Mill Qualification → RFQ
is a much safer sequence than:
Ranking → Purchase Decision
53. How Investors Should Use the Rankings
For investors, production scale provides context but not valuation.
Additional analysis should include:
- margins;
- cash flow;
- debt;
- capex;
- asset quality;
- regional exposure;
- product mix;
- decarbonization liabilities;
- growth projects.
A producer gaining ranking positions through acquisition may have very different financial characteristics from one growing organically.
The ranking identifies industrial scale.
It does not replace financial analysis.
54. How Competitors Should Use the Rankings
Competitive intelligence can use rankings to track:
- consolidation;
- expansion;
- regional shifts;
- emerging producers;
- acquisition effects.
But company-level analysis should move deeper.
Questions include:
- Where is capacity being added?
- Which products are targeted?
- Which markets are receiving exports?
- Which plants are being modernized?
- Which assets are being closed?
- Which production routes are being adopted?
Strategic movement matters more than rank alone.
55. How Policymakers Should Interpret Corporate Scale
For policymakers, steel-company concentration can affect:
- employment;
- regional industrial dependence;
- trade exposure;
- strategic supply;
- decarbonization investment.
But policy analysis should distinguish between:
- national production;
- corporate ownership;
- plant location;
- domestic consumption;
- trade flows.
A multinational producer may own domestic assets while being headquartered abroad.
National industrial capacity and corporate nationality are not the same concept.
56. The Ranking Should Be Updated Every Year
worldsteel states that its top-producer list is updated annually, and the 2026 publication provides the latest complete ranking for 2025.
Annual updating is essential because:
- ownership changes;
- acquisitions occur;
- output changes;
- new capacity starts;
- plants close;
- rankings shift.
Therefore, every ranking article should clearly display the production year.
Never publish “largest steel companies today” using an old dataset without identifying its reference period.
57. Watch the Difference Between Publication Year and Data Year
This is another frequent source of confusion.
World Steel in Figures 2026
contains the principal annual corporate ranking for:
2025 crude steel production.
The publication year and production year are not the same.
A technically accurate statement is:
According to World Steel in Figures 2026, China Baowu was the largest steel-producing company in 2025.
Not:
Baowu produced 124.76 Mt in 2026.
That would be incorrect.
58. The 2025 Ranking Reflects Major Structural Change
The top positions illustrate several simultaneous trends:
- China retains overwhelming industrial scale;
- Baowu remains clearly number one;
- corporate consolidation affects rankings;
- Nippon Steel moved into the top three under the updated ownership structure;
- India combines rapid national production growth with several large producers;
- major U.S., Japanese, Korean, European and Latin American groups remain strategically significant even though Chinese companies dominate the top ranks.
This is more informative than simply memorizing the top ten.
59. Future Leadership Will Depend on More Than Existing Capacity
The next phase of global steel competition will involve major changes in:
- energy;
- carbon regulation;
- scrap availability;
- iron ore quality;
- hydrogen;
- EAF investment;
- DRI;
- carbon capture;
- digitalization.
Existing production scale remains important.
But future competitiveness may increasingly depend on the ability to transform that production base.
A large legacy asset portfolio can provide cash generation and customer access while simultaneously requiring enormous transition investment.
60. The Largest Producer May Not Be the Most Relevant Competitor
For a buyer of a particular steel product, the most relevant competitor or supplier might rank:
- 5th;
- 20th;
- 50th;
- or outside the global ranking.
Why?
Because the actual market may depend on:
- product specialization;
- geographic proximity;
- certification;
- technical capability;
- logistics;
- trade access.
The correct question is not merely:
Who is the world’s largest steelmaker?
It is:
Which producers are competitively relevant to the specific steel market being analyzed?
61. Final Perspective
The global steel industry combines extreme geographic concentration with a more distributed corporate structure.
China produced more than half of the world’s crude steel in 2025, while the ten largest corporate producers together accounted for approximately 28% of global output.
China Baowu remained the world’s largest steel-producing group at 124.76 Mt.
ArcelorMittal ranked second.
Nippon Steel moved into third place under worldsteel’s 2025 ownership methodology, followed closely by Ansteel.
But the ranking itself is only the beginning of competitive analysis.
Crude steel production measures industrial scale.
It does not directly measure:
- profitability;
- product quality;
- technology leadership;
- export strength;
- market access;
- emissions performance;
- customer relevance.
The most useful analytical principle is therefore:
Rank steel companies by a clearly defined metric, then analyze competitive position using the variables that actually matter for the market in question.
That transforms a simple “Top Steel Companies” ranking into genuine steel-market intelligence.
Frequently Asked Questions
Who was the world’s largest steel producer in 2025?
China Baowu Group ranked first with 124.76 million tonnes of crude steel production according to World Steel in Figures 2026.
What were the world’s ten largest steel-producing companies in 2025?
The top ten were China Baowu, ArcelorMittal, Nippon Steel, Ansteel, HBIS, Shagang, Jianlong, POSCO Holdings, Delong Steel and Tata Steel Group.
Is the largest steel company determined by revenue or production?
It depends on the ranking methodology. The worldsteel producer ranking uses crude steel production. Revenue, capacity and shipments are separate metrics.
What percentage of global steel does China produce?
China produced 960.8 Mt out of global crude steel production of 1,848.9 Mt in 2025—slightly more than half of the global total.
How much of global crude steel is produced by the ten largest companies?
Using worldsteel’s 2025 figures, the top ten produced approximately 523 Mt, equivalent to about 28% of global crude steel production.
Why did Nippon Steel rise in the 2025 ranking?
Its worldsteel figure reflects the ownership structure at the end of 2025 and includes United States Steel Corporation along with other specified holdings. Therefore, corporate consolidation is an important part of the year-to-year comparison.
Is installed steel capacity the same as production?
No. Capacity represents potential output under defined conditions, while production measures actual steel produced during the period.
Does higher crude steel production mean higher profitability?
No. Profitability also depends on product mix, utilization, raw materials, energy, logistics, prices, debt and other factors.
Can a global steel-company ranking be used to choose a supplier?
Only as an initial screening tool. Supplier selection requires mill-level technical qualification, product availability, origin verification, commercial evaluation and landed-cost analysis.
How often should steel-company rankings be updated?
At least annually for an article based on global production rankings, and whenever major acquisitions or ownership changes materially alter company structures.
Technical References
World Steel Association — World Steel in Figures 2026
Primary statistical source for 2025 crude steel production by company and country, global production, steel demand, trade and other industry indicators.
World Steel Association — Top Steel-Producing Companies 2025/2024
Official company-ranking resource covering steel producers above the publication threshold and explaining the ownership methodology used for consolidated production.
World Steel Association — World Steel in Figures
Official archive providing annual editions from 2010 through 2026, useful for comparing company and country rankings over time.
World Steel Association — World Steel in Figures 2025
Previous annual edition used for comparison with 2024 company production and rankings.