
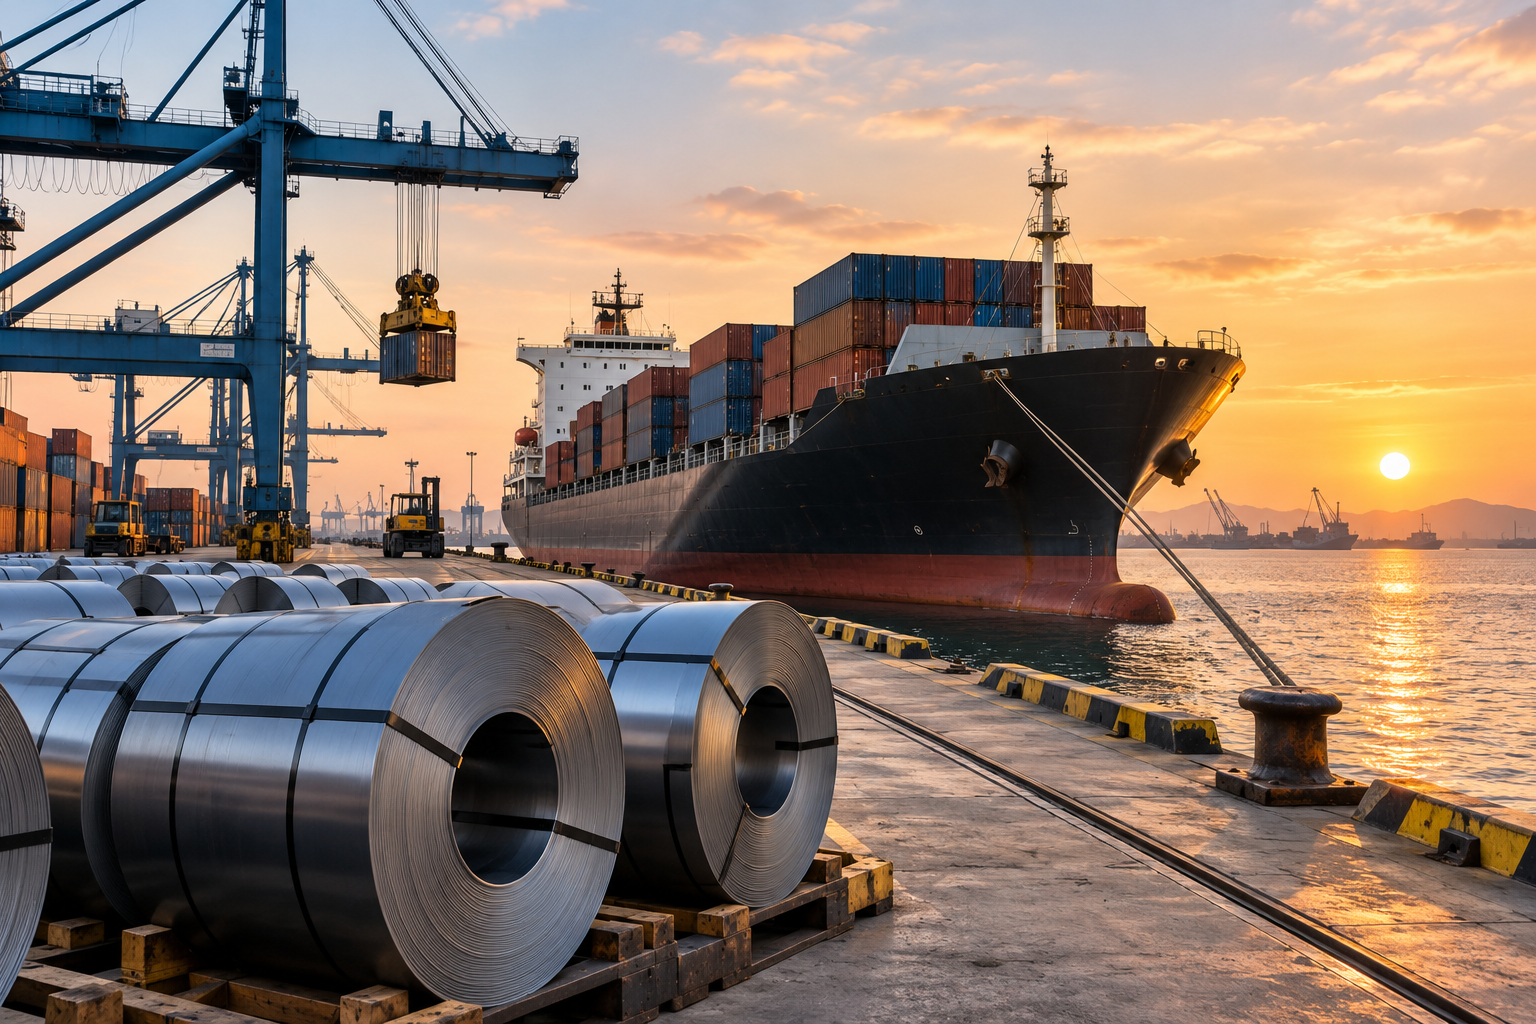
Maritime logistics has become one of the most important variables in the economics of international steel trade.
A steel transaction can be commercially attractive at the mill gate and still become uncompetitive by the time the material reaches the buyer.
Freight rates, vessel availability, route disruptions, insurance, port congestion, fuel costs and transit times can all change the landed cost of imported steel.
In 2026, this issue has become even more important.
The global steel industry is operating in an environment of weak demand growth, expanding excess capacity, intensifying trade measures and geopolitical disruption. At the same time, instability affecting major maritime chokepoints has demonstrated how quickly established shipping routes can become commercially or operationally unreliable.
For steel producers, service centers, distributors, traders and industrial buyers, maritime logistics can no longer be treated simply as a transportation function.
It is part of procurement strategy, working-capital management, inventory planning and commercial risk.
This article develops a practical framework for understanding how maritime disruption affects steel trade — and how companies can build more resilient sourcing and logistics strategies.
1. Why Maritime Logistics Matters So Much to the Steel Industry
Steel is particularly exposed to maritime logistics because international trade involves enormous physical volumes.
Flat products, long products, semi-finished steel, stainless steel, scrap, iron ore, metallurgical coal, ferroalloys and other raw materials move continuously between continents.
UN Trade and Development estimates that maritime transport carries more than 80% of international merchandise trade by volume.
That makes shipping infrastructure fundamental to global industrial supply chains.
For steel, however, the problem goes beyond cargo movement.
Transportation economics can determine whether a sourcing strategy is viable.
Consider a simplified imported-steel transaction:
| Cost component | Commercial impact |
|---|---|
| FOB steel price | Supplier competitiveness |
| Ocean freight | Direct landed-cost impact |
| Marine insurance | Risk-related cost |
| Port and terminal charges | Import logistics cost |
| Customs and trade measures | Market-access cost |
| Inland transportation | Final delivery cost |
| Inventory carrying cost | Working-capital impact |
| Financing | Cost of longer cash cycles |
A buyer therefore does not purchase only steel.
The buyer purchases a complete supply chain.
A low FOB price can be offset by expensive freight, long transit times, high inventory requirements or an unreliable shipping corridor.
This is why supplier comparisons based exclusively on USD/t FOB can be misleading.
2. Maritime Disruption Has Become Structural Rather Than Exceptional
For many years, companies treated major shipping disruptions as exceptional events.
That assumption has become increasingly difficult to defend.
The global logistics system has experienced overlapping disruptions involving geopolitical conflict, trade restrictions, port congestion, canal constraints, sanctions, environmental regulations and changes in trade flows.
UNCTAD’s Review of Maritime Transport 2025 described maritime transport as operating in an environment of growing volatility and uncertainty.
The Red Sea crisis demonstrated the magnitude of this vulnerability.
Ships that would normally use the Red Sea and Suez Canal were rerouted around the Cape of Good Hope, increasing voyage distances, vessel requirements, fuel consumption and operating costs.
UNCTAD estimated that these longer voyages contributed to a substantial increase in global ton-miles during the disruption.
The strategic lesson extends far beyond one conflict:
transportation distance is not fixed simply because the origin and destination remain unchanged.
Geopolitical events can effectively redraw the economic geography of steel trade.
3. The Red Sea and Suez Canal: A Critical Steel Trade Corridor
The Suez Canal connects the Mediterranean Sea with the Red Sea and provides one of the shortest maritime links between Asia and Europe.
Its importance extends to steel flows involving:
- Asian steel exports to Europe and the Mediterranean;
- Indian steel exports;
- Middle Eastern steel and raw-material flows;
- European exports toward Asia and the Middle East;
- containerized specialty steels;
- breakbulk and project cargo;
- industrial components containing substantial quantities of steel.
When vessels avoid Suez and sail around southern Africa, the consequences extend through the supply chain.
Longer voyages increase vessel utilization.
Higher vessel utilization reduces effective available shipping capacity.
Additional distance increases fuel consumption.
Transit-time variability complicates production and inventory planning.
Insurance and security considerations can also change rapidly.
The result is not merely a higher freight invoice.
It is a different supply-chain cost structure.
4. What Changed Between 2024 and 2026
The evolution of the Red Sea situation illustrates why logistics strategies cannot rely on static assumptions.
The major rerouting that began in late 2023 remained an important feature of global shipping through subsequent periods.
UNCTAD reported that Red Sea disruptions were a major driver of the sharp increase in container spot freight rates during 2024. Rerouting around the Cape of Good Hope extended voyage distances, increased vessel demand and raised operating costs.
By 2025, maritime freight remained characterized by significant volatility.
During 2026, some carriers began cautiously returning selected services to the Suez route.
In July, for example, Maersk announced structural changes returning its MECL service to the Red Sea, describing the move as another step toward a gradual return to the trans-Suez corridor. The carrier estimated transit-time improvements averaging seven days westbound and fourteen days eastbound for that particular service configuration.
That development demonstrated the potential economic benefit of route normalization.
But it also illustrated an important principle:
route normalization is reversible.
Security conditions can change much faster than industrial procurement cycles.
The renewed escalation affecting the region in September 2026 again demonstrates that companies cannot base annual sourcing strategies on the assumption that a maritime chokepoint will remain continuously available.
5. Maritime Chokepoints Are Supply-Chain Risk Multipliers
A maritime chokepoint concentrates enormous trade flows into a narrow geographical corridor.
Important examples include:
- Suez Canal;
- Bab el-Mandeb Strait;
- Strait of Hormuz;
- Strait of Malacca;
- Panama Canal;
- Turkish Straits.
The vulnerability arises from concentration.
A steel company may have diversified suppliers across several countries while remaining exposed to the same maritime corridor.
This creates an important distinction:
supplier diversification is not necessarily logistics diversification.
Suppose a European buyer purchases steel from suppliers in India, Vietnam and the Middle East.
On paper, the sourcing portfolio appears geographically diversified.
But if most cargo ultimately depends on the same vulnerable maritime corridor, the buyer may still have significant route concentration.
Supply-chain mapping should therefore include:
supplier → origin port → maritime corridor → transshipment hub → destination port → inland route → plant/customer
This reveals risks that supplier-level analysis alone cannot identify.
6. How Route Disruptions Affect Steel Freight Economics
Maritime disruption affects freight through several mechanisms simultaneously.
Longer sailing distance
Rerouting increases nautical miles.
That means more vessel-days are required for the same shipment.
Higher fuel consumption
Longer voyages generally require additional bunker consumption.
Fuel is one of the major operating costs in maritime transport.
Reduced effective fleet capacity
A ship that spends more time completing one voyage becomes unavailable for other cargo.
Even if the physical number of vessels does not change, effective transport capacity declines.
Equipment imbalance
Containerized steel products can also be affected by container availability and repositioning.
Port congestion
Changes in routes and transshipment patterns can concentrate cargo at alternative ports.
Higher insurance and security costs
Risk premiums can change when vessels operate near conflict zones.
Schedule unreliability
Even where freight rates remain manageable, unpredictable arrival dates can create significant industrial costs.
This last factor is often underestimated.
7. Freight Rate Is Only One Part of the Real Logistics Cost
A common procurement error is treating ocean freight as the complete logistics impact.
The true economic effect is broader.
A useful concept is:
Total Logistics Exposure = Direct Freight Cost + Inventory Cost + Financing Cost + Delay Risk + Operational Disruption Cost
Not every component can be measured precisely in advance.
But ignoring them does not make them disappear.
Consider two suppliers:
| Variable | Supplier A | Supplier B |
|---|---|---|
| FOB steel price | USD 650/t | USD 670/t |
| Ocean freight | USD 70/t | USD 50/t |
| Expected transit | 50 days | 30 days |
| Reliability | Moderate | High |
| Required safety stock | Higher | Lower |
Supplier A appears cheaper at FOB level.
After freight, both reach USD 720/t before other costs.
But Supplier A still requires more working capital and more inventory protection.
The apparently cheaper supplier may therefore have the higher economic cost.
This is why professional steel sourcing should evaluate landed cost and supply-chain risk together.
For a deeper discussion of this methodology, see the Steel In Focus analysis on exchange rates, steel trade and landed cost.
8. Transit Time Is a Financial Variable
Transit time is frequently treated as an operational metric.
It should also be treated as a financial metric.
Suppose an importer purchases 5,000 tonnes of steel at a total cargo value of USD 3.5 million.
If disruption adds several weeks to the procurement cycle, capital remains committed for longer before the material can be transformed, sold or delivered.
That can increase:
- financing requirements;
- interest expense;
- inventory in transit;
- safety-stock requirements;
- cash-conversion cycle;
- exposure to price movements;
- foreign-exchange exposure.
Longer lead times also reduce the company’s ability to respond to changes in demand.
The cost of logistics disruption therefore includes the time value of inventory.
9. The Bullwhip Effect in Steel Supply Chains
Long and uncertain lead times can amplify inventory decisions throughout the supply chain.
Imagine that a distributor experiences several delayed shipments.
Management increases safety stock.
Customers, worried about availability, place orders earlier than normal.
Suppliers interpret stronger orders as genuine demand growth.
Production increases.
Months later, delayed cargo arrives while customer inventories are already elevated.
Orders suddenly decline.
The market appears to move rapidly from shortage to oversupply.
This mechanism is particularly relevant to steel because production, maritime transportation and inventory cycles are long.
Logistics volatility can therefore contribute to price volatility even when underlying end-user demand has changed relatively little.
10. Steel Products Do Not Have the Same Logistics Exposure
Different steel products require different logistics strategies.
Commodity flat steel
Hot-rolled coil, cold-rolled coil and coated steel frequently compete strongly on delivered price.
Freight movements of USD 20–40/t can materially affect supplier competitiveness.
Heavy plate
Plate shipments can involve breakbulk logistics, specialized handling and project schedules.
Reliability may be more important than the lowest freight quotation.
Long products
Rebar, wire rod and sections generally have relatively low value density.
Transportation costs can represent a significant percentage of delivered value.
Stainless steel
Higher product value can reduce freight as a percentage of total cargo value, but availability and quality requirements may make disruption costly.
Electrical steel
Qualification requirements and limited approved suppliers can make alternative sourcing difficult.
Specialty and tool steels
Volumes may be smaller, but industrial consequences of late delivery can be substantial.
Raw materials
Iron ore, metallurgical coal, scrap and ferroalloys operate under very different shipping economics, often involving bulk carriers and specialized trade flows.
A single logistics strategy cannot therefore be applied to every steel category.
11. Bulk, Breakbulk and Containerized Steel Require Different Risk Models
Steel moves through several maritime transport modes.
| Transport mode | Typical steel-related cargo | Main logistics considerations |
|---|---|---|
| Dry bulk | Iron ore, coal, some scrap | Vessel availability, port draft, commodity freight |
| Breakbulk | Coils, plate, sections, project cargo | Handling, stowage, damage prevention |
| Container | Specialty steel, smaller lots, components | Container availability, liner schedules, transshipment |
| Ro-Ro/project | Equipment and fabricated structures | Specialized vessel capacity and schedule |
This distinction matters because freight indices and disruptions affect each segment differently.
A container freight surge cannot automatically be applied to a bulk iron-ore shipment.
Likewise, dry-bulk freight conditions do not necessarily represent the economics of containerized stainless steel.
Procurement teams should therefore avoid statements such as:
“Ocean freight increased by 30%.”
The correct question is:
“Which freight market, route, vessel type, cargo configuration and contract structure increased by 30%?”
Without those qualifications, the number has limited analytical value.
12. Freight Volatility Can Reverse Supplier Rankings
Steel procurement frequently involves supplier comparison tables.
A typical comparison may include:
- grade;
- specification;
- dimensions;
- coating;
- mechanical properties;
- origin;
- MOQ;
- FOB price;
- payment terms;
- lead time.
But freight should not be entered as a static number.
Consider three hypothetical suppliers:
| Supplier | FOB | Freight | CFR equivalent |
|---|---|---|---|
| A | USD 640/t | USD 85/t | USD 725/t |
| B | USD 660/t | USD 55/t | USD 715/t |
| C | USD 675/t | USD 35/t | USD 710/t |
The lowest FOB supplier becomes the highest-cost option after freight.
Now suppose disruption raises Supplier C’s freight to USD 75/t.
Its CFR equivalent becomes USD 750/t.
The ranking changes again.
This demonstrates why international steel sourcing requires continuous landed-cost monitoring rather than annual static supplier rankings.
13. Exchange Rates and Freight Risk Can Reinforce Each Other
International steel transactions often combine several market exposures.
A Brazilian importer, for example, may purchase steel in USD while generating revenue in BRL.
Ocean freight may also be quoted in USD.
If the domestic currency depreciates while freight rates rise, the effects compound.
A USD 30/t freight increase does not remain a USD 30/t issue.
Its domestic-currency impact depends on the exchange rate at the relevant payment date.
This is why freight and foreign-exchange risk should not be managed independently.
The Steel In Focus article How Exchange Rates Impact Steel Trade, Pricing and Landed Cost examines this interaction in greater detail.
14. Logistics Risk and Global Steel Overcapacity
Maritime logistics cannot be analyzed separately from the broader steel market.
The OECD’s Steel Outlook 2026 estimates that global steelmaking excess capacity reached approximately 640 million tonnes in 2025 and could rise to about 745 million tonnes by 2028.
China exported a record 131 million tonnes of steel in 2025 according to the OECD.
This matters for logistics because excess capacity encourages producers to seek distant export markets.
More steel moves across longer international supply chains.
At the same time, governments are increasing trade measures.
The result is a constantly changing network of:
- export destinations;
- alternative origins;
- transshipment patterns;
- trade barriers;
- freight corridors;
- sourcing opportunities.
The lowest-priced steel may therefore originate farther from the buyer precisely when maritime routes are becoming less predictable.
15. Trade Measures Can Change Logistics Overnight
Antidumping duties, countervailing duties, safeguards, tariffs and sanctions can redirect steel flows rapidly.
According to the OECD, 75 new steel antidumping and countervailing-duty investigations were initiated globally in 2025.
When one market becomes commercially inaccessible, exporters search for alternative destinations.
This changes regional cargo flows and potentially affects vessel demand.
For procurement teams, this means logistics intelligence should be combined with trade-policy intelligence.
A supplier that is competitive today may become economically unviable after a trade measure.
Conversely, a country previously ignored by buyers may become strategically attractive.
For a broader analysis of these market dynamics, see Emerging Steel Markets in 2026: Opportunities, Risks and Export Strategy.
16. Inventory Strategy Must Change When Lead-Time Variability Increases
Traditional inventory planning frequently uses average lead time.
During unstable maritime conditions, the average may become misleading.
Consider these hypothetical shipment times:
28 days
29 days
31 days
30 days
54 days
62 days
The average is useful statistically.
Operationally, however, the variability may be more important.
A plant shutdown does not occur because the average lead time was wrong.
It occurs because a specific critical shipment arrived too late.
Companies should therefore monitor:
- average transit time;
- maximum observed transit;
- standard deviation;
- schedule reliability;
- port dwell time;
- customs clearance time;
- supplier production lead time;
- total order-to-delivery cycle.
Safety stock should reflect variability, not merely averages.
17. Critical Steel Should Be Managed Differently From Commodity Steel
Not every imported tonne deserves the same risk policy.
A useful segmentation is:
Category A — Critical materials
Materials whose absence can stop production.
Examples may include qualified electrical steels, specialized alloy grades or customer-approved automotive material.
Strategy:
- higher safety stock;
- dual sourcing where technically possible;
- stronger logistics visibility;
- priority transportation.
Category B — Commercially important materials
High-volume products with multiple potential suppliers.
Strategy:
- competitive sourcing;
- moderate safety stock;
- flexible origin portfolio.
Category C — Easily substitutable materials
Products available from multiple domestic and international sources.
Strategy:
- cost optimization;
- lower inventory buffers;
- opportunistic purchasing.
This approach prevents companies from spending the same amount of working capital protecting every SKU.
18. Supplier Diversification Must Include Origin and Route
A common resilience recommendation is “diversify suppliers.”
That is incomplete.
A robust diversification strategy should consider at least four dimensions:
| Dimension | Question |
|---|---|
| Supplier | Do we depend excessively on one company? |
| Country | Do suppliers share the same political/trade risk? |
| Port | Do shipments depend on one export or import terminal? |
| Route | Do cargoes cross the same maritime chokepoint? |
Two suppliers can be commercially independent but logistically correlated.
This concept is especially important for steel buyers sourcing from multiple Asian origins.
19. Incoterms Determine Who Controls Logistics — Not Who Escapes the Cost
Incoterms influence responsibility for freight, insurance and delivery obligations.
They do not eliminate logistics risk.
Under FOB arrangements, the buyer typically has greater control over international freight contracting.
Under CFR or CIF arrangements, the seller arranges ocean transportation.
But the economic consequences of disruption ultimately affect the transaction.
Important questions include:
- Who selects the carrier?
- Who controls the booking?
- Who bears freight escalation?
- How are surcharges treated?
- What happens if the route changes?
- Who controls insurance?
- What constitutes delivery?
- How are demurrage and detention allocated?
- What happens when shipment dates slip?
These questions should be resolved contractually before disruption occurs.
20. Freight Contracts Need More Than a Base Rate
A freight quotation can contain multiple components.
Depending on the transport mode and route, these may include:
- base ocean freight;
- bunker-related adjustments;
- war-risk surcharge;
- congestion surcharge;
- peak-season surcharge;
- terminal handling;
- documentation;
- security-related charges;
- container detention/demurrage;
- port-specific charges.
Procurement teams should compare the all-in freight structure, not only the headline rate.
The same principle applies when comparing steel suppliers.
A low CFR quotation may contain contractual conditions that transfer substantial future cost risk to the buyer.
21. The Hidden Cost of Demurrage and Detention
Ocean freight receives considerable management attention.
Port-related delay costs often receive less.
For imported steel, delays can result from:
- documentation errors;
- customs issues;
- import licensing;
- inspection;
- port congestion;
- lack of trucking capacity;
- warehouse constraints;
- slow unloading.
Containerized cargo may accumulate detention or demurrage.
Breakbulk cargo can generate other port and storage costs.
These expenses should be included in supplier and route performance reviews.
A theoretically efficient ocean route can become expensive if the destination-port process is unreliable.
22. Port Diversification Can Improve Resilience — But Not Automatically
Using alternative ports can reduce concentration risk.
However, port diversification should be evaluated through total landed cost.
An alternative port may offer:
- lower congestion;
- better vessel availability;
- more reliable schedules;
- reduced security exposure.
But it may also create:
- longer inland haulage;
- higher terminal charges;
- limited handling equipment;
- lower frequency;
- inadequate coil or plate storage;
- greater cargo-damage risk.
The best port is not necessarily the closest port.
It is the port that provides the best combination of cost, capability, reliability and inland connectivity.
23. Steel Cargo Requires Specialized Handling
Steel is heavy, dense and vulnerable to specific types of damage.
Coils can suffer:
- edge damage;
- telescoping;
- deformation;
- corrosion;
- seawater contamination.
Plate can experience:
- surface damage;
- bending;
- corrosion;
- handling marks.
Coated and cold-rolled products require particularly careful moisture protection.
Therefore, logistics resilience cannot be measured only by whether cargo arrives.
The material must arrive within specification.
Procurement and logistics teams should verify:
- packaging standards;
- lashing;
- stowage;
- moisture protection;
- vessel suitability;
- terminal handling;
- survey requirements;
- claims procedures.
A cheaper freight option that increases damage risk may destroy its apparent savings.
24. Marine Insurance Should Be Treated as a Technical Procurement Issue
Marine insurance is sometimes treated as administrative documentation.
For high-value steel cargo, this can be a mistake.
Important elements include:
- insured value;
- covered risks;
- exclusions;
- deductible;
- war-risk provisions;
- route limitations;
- cargo-damage procedures;
- survey requirements;
- claim notification deadlines.
The insurance structure should match the cargo.
Cold-rolled or coated steel exposed to moisture risk is different from heavy structural sections.
A procurement team should understand what happens financially if the cargo arrives damaged.
25. Building a Steel Logistics Risk Matrix
Companies can convert qualitative risks into a structured decision process.
A practical matrix may use:
| Risk factor | Weight |
|---|---|
| Freight volatility | 15% |
| Transit-time variability | 15% |
| Route geopolitical exposure | 15% |
| Supplier reliability | 15% |
| Port reliability | 10% |
| Alternative-route availability | 10% |
| Cargo criticality | 10% |
| Inventory coverage | 10% |
Each supplier-route combination can be scored.
The objective is not to create mathematical precision where none exists.
The objective is to force decision-makers to evaluate risks systematically rather than intuitively.
26. Scenario Analysis Is Better Than a Single Freight Forecast
Predicting the exact future freight rate is extremely difficult.
Scenario analysis is often more useful.
For example:
| Scenario | Logistics assumption | Procurement response |
|---|---|---|
| Normalization | Main route available, freight easing | Reduce excess safety stock |
| Volatility | Intermittent disruption | Maintain diversified bookings |
| Severe disruption | Chokepoint unavailable | Activate alternative route/origin |
| Compound shock | Route disruption + FX deterioration | Protect cash and prioritize critical materials |
Management can then define actions before the event occurs.
This transforms logistics from reactive firefighting into structured risk management.
27. A Practical Landed-Cost Stress Test
Suppose a company evaluates an imported coil:
- FOB price: USD 680/t
- Normal freight: USD 45/t
- Other foreign logistics/insurance: USD 5/t
Normal foreign-cost basis:
USD 730/t
Now assume maritime disruption increases freight from USD 45/t to USD 80/t.
Revised basis:
USD 765/t
The increase is USD 35/t.
For a 5,000-tonne shipment:
Additional direct freight exposure = USD 175,000
But that is still incomplete.
If the route disruption also adds three weeks to the procurement cycle, the company may need additional inventory and financing.
The management question is therefore not simply:
Can we absorb USD 35/t more freight?
It is:
What is the combined margin, working-capital and customer-service impact of the disruption?
28. Freight Sensitivity Should Be Included in Supplier Selection
Supplier qualification traditionally emphasizes:
- technical capability;
- quality certification;
- production capacity;
- financial condition;
- price;
- delivery.
For international steel, logistics sensitivity should become another formal criterion.
A sourcing model can test each supplier at:
- normal freight;
- +USD 20/t;
- +USD 40/t;
- +USD 60/t.
If a supplier becomes uncompetitive after a relatively small freight movement, its commercial advantage is fragile.
This type of sensitivity analysis is especially useful for distant commodity-steel sources.
29. Digital Visibility Is Becoming Essential
Long international supply chains require timely information.
Useful logistics data may include:
- booking confirmation;
- vessel nomination;
- actual departure;
- vessel position;
- transshipment status;
- estimated arrival;
- port congestion;
- customs status;
- warehouse receipt.
Integrating these signals with procurement and inventory systems allows planners to react before a delay becomes a shortage.
Artificial intelligence and predictive analytics can further support this process by combining historical transit performance, demand forecasts and external market indicators.
Steel In Focus examines these methods in AI and Predictive Analytics in Steel Demand Forecasting: A Practical Framework.
30. Logistics KPIs for International Steel Procurement
A mature procurement organization should monitor more than freight USD/t.
Useful KPIs include:
| KPI | Purpose |
|---|---|
| Freight USD/t | Direct transport cost |
| Freight as % of landed cost | Cost sensitivity |
| Order-to-delivery lead time | Total supply-cycle performance |
| Transit-time variability | Reliability |
| On-time shipment rate | Supplier/logistics performance |
| On-time delivery rate | Customer-service performance |
| Port dwell time | Terminal efficiency |
| Demurrage/detention per tonne | Hidden logistics cost |
| Cargo claims rate | Handling/quality performance |
| Inventory days | Working-capital impact |
| Emergency freight cost | Resilience failure indicator |
| Route concentration | Geopolitical exposure |
These indicators allow logistics performance to be connected directly to financial results.
31. The Relationship Between Logistics and Working Capital
Supply-chain resilience is not free.
Increasing safety stock reduces shortage risk but consumes cash.
Reducing inventory releases working capital but increases vulnerability.
The correct inventory level therefore depends on:
- demand variability;
- lead-time variability;
- material criticality;
- supplier alternatives;
- domestic availability;
- production consequences of shortage;
- financing cost.
This is particularly important in steel because inventory values are large.
A small change in inventory days across thousands of tonnes can have a significant balance-sheet effect.
32. Nearshoring and Regional Sourcing: Useful but Not Universal
Geopolitical disruption has increased interest in nearshoring and regional sourcing.
Potential benefits include:
- shorter transit;
- lower route exposure;
- faster replenishment;
- lower safety stock;
- easier supplier visits;
- potentially lower working capital.
But regional sourcing is not automatically cheaper or technically feasible.
Local suppliers may have:
- higher mill prices;
- limited grades;
- different dimensional capabilities;
- higher minimum quantities;
- insufficient capacity.
The correct comparison is again total economic value rather than geographic distance alone.
33. When a More Expensive Supplier Is Actually Cheaper
Suppose Supplier A offers steel at USD 650/t FOB and Supplier B at USD 680/t FOB.
At first glance, Supplier A saves USD 30/t.
But Supplier A requires:
- longer transit;
- more expensive freight;
- greater safety stock;
- higher financing;
- higher disruption probability.
Supplier B may therefore produce lower total cost.
This is one of the central principles of strategic steel procurement:
purchase price is not the same as procurement cost.
The cheapest tonne is the tonne with the lowest risk-adjusted landed cost that still satisfies technical and delivery requirements.
34. Logistics Resilience and Customer Service
Supply-chain reliability can become a commercial advantage.
A distributor that consistently delivers steel during periods of market disruption may gain customer loyalty even if its nominal price is not always the lowest.
Likewise, steel producers that can maintain export commitments during logistical disruption may strengthen long-term customer relationships.
This means resilience has revenue value as well as cost value.
Management should therefore avoid evaluating resilience investments exclusively through immediate logistics savings.
35. A Practical Implementation Framework
A steel company can build a more resilient maritime logistics strategy through a structured sequence.
Step 1 — Map the physical supply chain
Identify supplier, origin port, maritime corridor, transshipment points, destination port and inland transport.
Step 2 — Identify concentration
Determine whether multiple suppliers depend on the same port or chokepoint.
Step 3 — Calculate true landed cost
Include freight, insurance, port costs, duties, inland transport and financing.
Step 4 — Measure lead-time variability
Do not rely only on contractual or average transit times.
Step 5 — Segment materials by criticality
Protect production-critical grades more aggressively.
Step 6 — Develop alternative origins and routes
Qualify alternatives before disruption occurs.
Step 7 — Stress-test freight
Model different freight and exchange-rate scenarios.
Step 8 — Review Incoterms and freight contracts
Clarify cost and risk allocation.
Step 9 — Integrate logistics with inventory planning
Adjust safety stock according to actual route reliability.
Step 10 — Monitor external risk indicators
Track geopolitical developments, carrier advisories, freight markets and trade measures.
36. What Management Should Ask Every Month
A useful maritime-risk review does not need to be complicated.
Management should be able to answer:
- Which shipments are currently exposed to high-risk corridors?
- Which materials could stop production if delayed?
- How many days of inventory coverage exist?
- Which alternative suppliers are already technically qualified?
- What would happen to landed cost if freight increased by USD 30/t?
- What happens if transit increases by 20 days?
- Which suppliers depend on the same ports or maritime routes?
- Are freight and FX exposures being evaluated together?
- Which customers would be affected first by a delay?
- What is the predefined response if the main route becomes unavailable?
If these questions cannot be answered quickly, the organization probably has insufficient supply-chain visibility.
37. The 2026 Strategic Context
Maritime logistics risk is particularly important because it is occurring alongside structural changes in the steel industry.
The OECD projects global steel demand growth to remain weak while excess capacity continues expanding.
At the same time, international trade measures are increasing and steel flows are being redirected toward new markets.
Middle East instability adds another layer of uncertainty through energy prices, raw-material movements and maritime transportation.
The combined environment can be summarized as:
more excess steel + more trade barriers + more geopolitical risk + more volatile logistics.
That combination makes simplistic supplier selection increasingly dangerous.
International steel procurement must become multidimensional.
38. From Logistics Cost to Supply-Chain Strategy
The most important change is conceptual.
Maritime logistics should no longer be viewed as the final operational step after procurement negotiates the steel price.
Logistics should participate in the sourcing decision from the beginning.
The relevant decision is not:
Which supplier offers the lowest steel price?
Nor is it:
Which carrier offers the lowest freight?
The correct question is:
Which combination of supplier, origin, route, freight structure, inventory policy and contractual terms creates the lowest sustainable risk-adjusted landed cost?
That question connects procurement, logistics, finance, sales and operations.
39. Final Perspective
The Red Sea crisis has provided a powerful demonstration of how geopolitical events can change the economics of global steel trade.
But the broader lesson is more important than any single route.
Maritime transportation has become a strategic risk variable.
Steel companies that rely on international supply chains need to understand not only steel prices, but also freight markets, maritime chokepoints, inventory economics, trade policy and geopolitical exposure.
The companies best positioned to manage future disruptions will not necessarily be those that predict every crisis correctly.
They will be those that build supply chains capable of functioning when forecasts are wrong.
That means diversifying intelligently, measuring landed cost correctly, maintaining visibility over critical materials, developing alternative routes and suppliers, and integrating logistics decisions with financial planning.
In global steel trade, resilience is no longer separate from competitiveness.
It is part of competitiveness.
Technical References
UN Trade and Development (UNCTAD) — Review of Maritime Transport 2025: Staying the Course in Turbulent Waters
Primary reference for global maritime trade, Red Sea rerouting, freight-rate volatility, route disruption and maritime supply-chain resilience.
OECD — Steel Outlook 2026
Current assessment of global steel demand, production capacity, excess capacity, international trade and structural market conditions.
OECD — Steel Market and Industry Prospects
Supporting source for 2026 steel demand, international steel trade and changing market flows.
OECD — Trade Actions Increase as the Steel Crisis Worsens
Supporting source for antidumping, countervailing measures, trade diversion and increasing restrictions affecting global steel trade.