
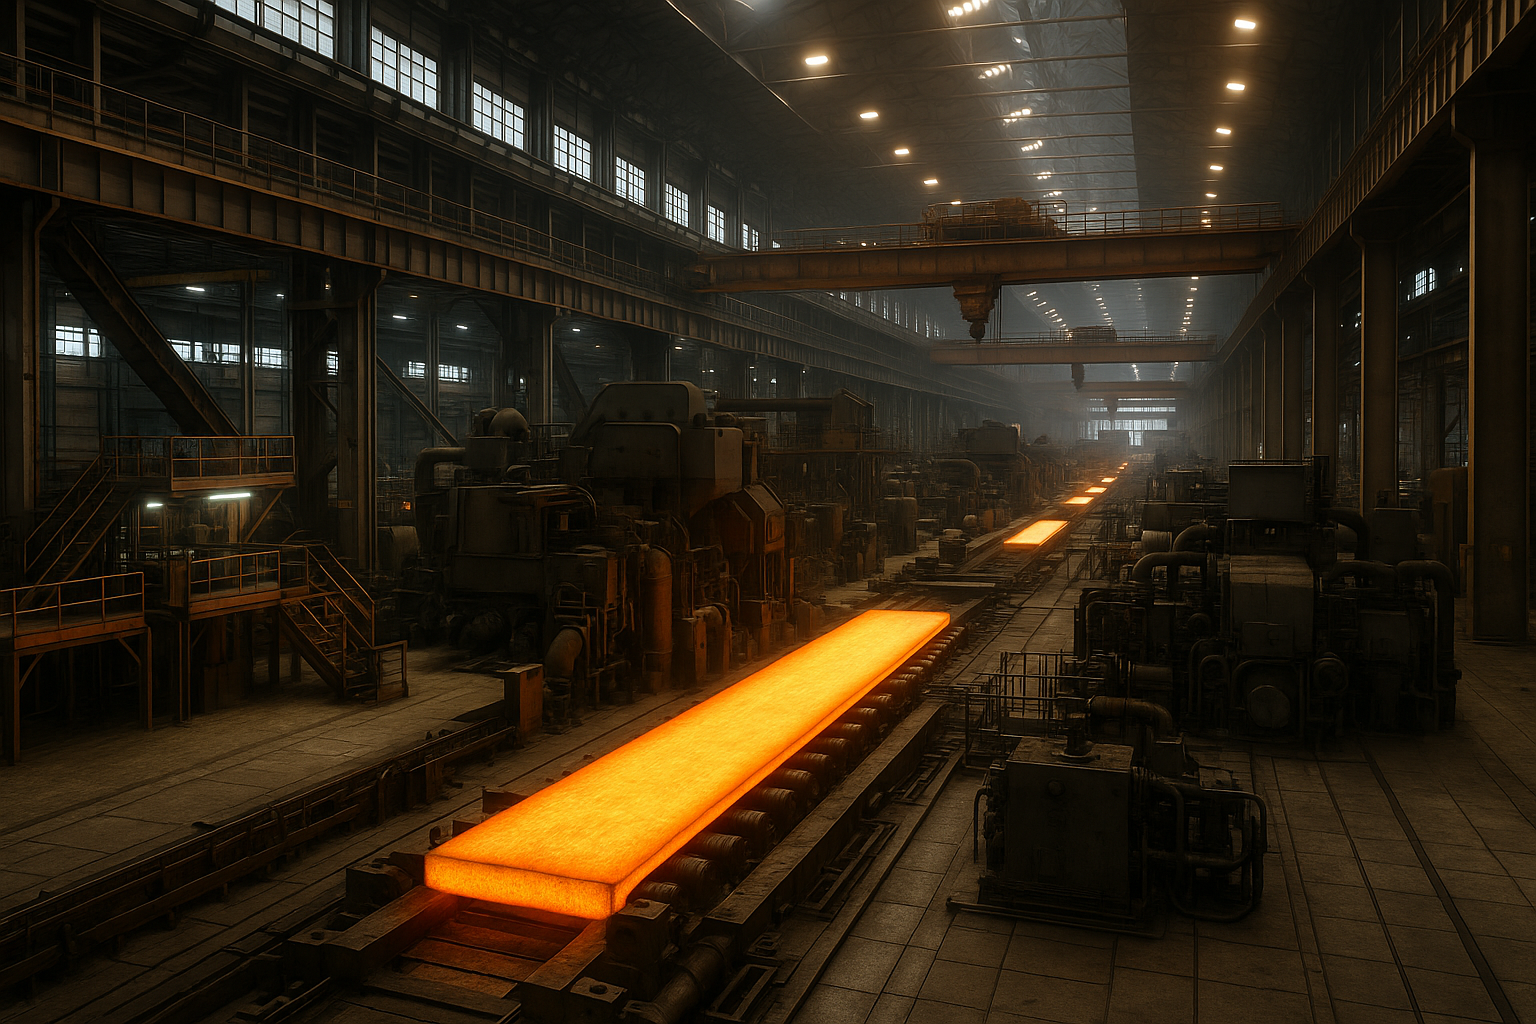
The COVID-19 pandemic exposed weaknesses in global steel supply chains, disrupted industrial activity, and contributed to extraordinary volatility in production, logistics, and prices.
Yet the global steel industry’s challenges in 2026 cannot be explained simply as the continuing aftermath of the pandemic.
The sector now faces a more complex environment: persistent excess steelmaking capacity, uneven regional demand, trade restrictions, geopolitical uncertainty, industrial decarbonization, and accelerating technological change.
Some developments were intensified by the pandemic. Others reflect longer-term structural forces that existed before 2020 or emerged independently afterward.
Understanding this distinction is essential for steel manufacturers, distributors, industrial buyers, importers, exporters, and investors.
This article examines how the global steel industry has changed since COVID-19, evaluates the market conditions visible in 2026, and identifies the indicators and strategic decisions that will matter in the years ahead.
Editorial reference date: October 10, 2026. Historical figures are identified separately from forecasts. Regulatory requirements and market conditions should be verified against the latest official sources before commercial decisions are made.
1. The Steel Industry Before, During and After COVID-19
The pandemic was a major disruption, but its effects differed substantially across countries and steel-consuming industries.
In 2020, restrictions on industrial activity, transportation, construction, and international movement interrupted normal commercial operations.
Steel mills faced changes in demand, staffing constraints, logistical disruptions, and uncertainty over customer orders.
During the subsequent recovery, many markets experienced strong price movements, inventory rebuilding, transportation bottlenecks, and changes in purchasing behavior.
However, the recovery was not uniform.
Some economies restored industrial production relatively quickly, while others experienced prolonged weakness in particular sectors.
Three distinct periods
A useful historical interpretation separates developments into three phases.
2020: Initial disruption
Industrial shutdowns, reduced mobility, uncertainty, and interruptions in supply chains affected steel production and consumption.
2021–2022: Recovery and volatility
Restocking, changes in demand, logistical constraints, energy costs, and other macroeconomic developments contributed to significant market volatility.
2023–2026: Structural adjustment
Steel markets increasingly reflected persistent problems such as weak demand in some regions, excess production capacity, trade tensions, financing costs, and decarbonization requirements.
This distinction matters because a commercial strategy designed for a temporary supply shortage may be inappropriate in a market characterized by structural oversupply.
2. What Actually Changed After the Pandemic?
Several practices became more prominent following the disruptions of 2020–2022.
Companies placed greater attention on supply continuity, supplier diversification, inventory policies, and the ability to respond to unexpected disruptions.
Remote monitoring, digital collaboration, and more systematic supply chain risk assessments also became more relevant.
However, these changes should not be interpreted as universal or irreversible.
Not every steel company adopted the same technologies, increased inventories, or regionalized production.
The economic consequences of each strategy depend on product characteristics, geography, operating scale, and financial resources.
Changes that deserve continued attention
- Greater visibility into critical suppliers and transportation routes.
- More formal contingency planning.
- Increased attention to lead-time variability.
- Digital monitoring of equipment and logistics.
- Evaluation of alternative suppliers.
- More detailed inventory risk analysis.
- Stronger coordination between purchasing, production, and sales.
The most important lesson is not that every company should hold more inventory or buy locally.
It is that supply chain decisions should account explicitly for the financial consequences of disruptions.
3. Global Steel Production: The 2025 Baseline
The World Steel Association’s updated annual production database reports approximately 1,850.3 million tonnes of global crude steel production in 2025, based on data updated in July 2026.
This is a historical production figure, not a forecast.
Crude steel production measures steel in its initial solid or usable form, including semifinished products. It should not be confused with finished steel demand.
Why the distinction matters
A steel market analysis may refer to:
- Crude steel production.
- Finished steel production.
- Apparent steel consumption.
- Steelmaking capacity.
- Import and export volumes.
- End-user demand.
These indicators measure different activities.
A country may produce more crude steel while domestic consumption declines, especially if exports increase.
Similarly, a decline in crude steel output does not necessarily imply an equivalent decline in the availability of every finished product.
Key interpretation
Global production figures provide an essential benchmark, but decisions involving hot-rolled coil, rebar, galvanized steel, plate, or specialty grades require more detailed product-level analysis.
4. Global Steel Demand Outlook for 2026 and 2027
In its April 2026 Short Range Outlook, the World Steel Association forecast global steel demand of:
| Indicator | 2026 forecast | 2027 forecast |
|---|---|---|
| Global steel demand | 1,724 Mt | 1,762 Mt |
| Annual growth | 0.3% | 2.2% |
These forecasts describe finished steel demand as defined by the worldsteel outlook. They are not directly interchangeable with crude steel production statistics.
The figures suggest limited global demand growth in 2026 followed by a stronger recovery in 2027.
However, the forecast includes important assumptions and uncertainties.
The worldsteel release explicitly identified geopolitical developments and energy-related risks as potential reasons for downward revisions.
How to use these forecasts
A buyer should not interpret projected global demand growth as a guarantee of higher prices.
A producer should not assume that stronger demand will automatically improve profitability.
Prices and margins also depend on production capacity, inventories, imports, raw material costs, and competitive conditions.
Forecasts are most useful when combined with alternative scenarios and regularly updated market indicators.
5. China: A Structural Rebalancing of Steel Demand
China remains central to the global steel market because of its scale of production, domestic consumption, and international trade.
The country’s property sector adjustment has contributed to weaker steel demand in important construction-related applications.
At the same time, manufacturing activity, infrastructure investment, and exports can support other parts of the steel market.
Production and demand are different questions
The worldsteel April 2026 outlook projected a 1.5% contraction in Chinese steel demand during 2026, followed by broadly stable demand in 2027.
These are projections rather than confirmed outcomes.
The distinction between domestic demand and production is especially important in China.
If domestic consumption weakens more rapidly than output, producers may seek additional export markets.
This can intensify competition internationally even when global demand is not expanding rapidly.
Implications for international buyers
Chinese export quotations should be evaluated together with:
- Product specifications and quality requirements.
- Applicable antidumping and other trade measures.
- Origin documentation.
- Freight and insurance.
- Exchange-rate exposure.
- Delivery periods.
- Supplier qualification.
- Contract enforcement and payment risk.
A low nominal export price does not necessarily produce the lowest compliant delivered cost.
6. India: Demand Growth and Industrial Expansion
India is an important source of growth in global steel consumption.
Its steel demand is supported by infrastructure, construction, manufacturing, transportation, and industrial investment.
The April 2026 worldsteel outlook projected Indian steel demand growth of 7.4% in 2026 and 9.2% in 2027.
These projections indicate strong growth relative to many mature markets.
However, strong domestic demand can also absorb production that might otherwise be available for export.
Commercial implications
International buyers considering Indian suppliers should evaluate:
- Available export volumes.
- Product qualification.
- Production capacity and utilization.
- Domestic demand conditions.
- Applicable export and import policies.
- Logistics and delivery reliability.
- Price competitiveness after all transaction costs.
India’s industrial expansion creates opportunities for steel producers and equipment suppliers, but it does not establish that every Indian steelmaker will become a major exporter.
7. Europe: Demand Recovery and Structural Cost Pressures
European steel markets face a combination of industrial, energy, trade, and environmental challenges.
The worldsteel April 2026 outlook projected steel demand growth of 1.3% in the EU and United Kingdom region in 2026, followed by 3.0% in 2027.
The projected recovery should be considered alongside energy costs, industrial competitiveness, import competition, and investment requirements.
Energy sensitivity
Steel production can be highly sensitive to electricity, natural gas, coal, and other energy inputs.
The impact varies by production route.
Electric arc furnace operations are particularly exposed to electricity conditions, while integrated production has a different combination of energy and reducing-agent requirements.
Decarbonization investment
European steelmakers also face substantial investment decisions involving process efficiency, electric arc furnaces, direct reduced iron, renewable electricity, and other technologies.
The commercial feasibility of these investments depends on operating costs, infrastructure, financing, policy support, and market demand for lower-emissions products.
8. United States: Industrial Demand, Investment and Trade Policy
The U.S. steel market is influenced by construction, automotive production, machinery, energy infrastructure, industrial investment, and trade policy.
The April 2026 worldsteel outlook projected U.S. steel demand growth of 1.7% in 2026 and 2.0% in 2027.
These projections reflect a combination of industrial investment and expectations for demand recovery.
However, the U.S. market also presents specific regulatory complexities.
Trade policy exposure
Steel importers and exporters must evaluate the applicable U.S. Harmonized Tariff Schedule classification, origin rules, product coverage, trade remedies, and other legal requirements.
The existence of a general tariff announcement does not establish the duty applicable to a particular shipment.
For a detailed examination of this issue, see Brazil–U.S. Steel Trade in 2026: Tariffs, Section 232 and Export Risk Management.
Strategic implication
Manufacturers and distributors should avoid relying exclusively on headline tariff rates when comparing domestic and imported steel.
Product-specific classification and transaction-level analysis are essential.
9. Southeast Asia and Emerging Steel Markets
Southeast Asian markets have experienced significant changes in steel demand, production capacity, and international investment.
Some economies are expanding manufacturing and infrastructure activity while also developing additional steelmaking capacity.
This creates opportunities but may also increase regional competition.
The OECD Steel Outlook 2026 identifies Southeast Asia as an important area of capacity expansion.
Why growth does not always mean higher margins
A region can experience increasing steel demand and increasing excess capacity simultaneously.
If production capacity expands faster than consumption, utilization and profitability may deteriorate despite growing sales volumes.
Markets require individual analysis
Vietnam, Indonesia, Thailand, Malaysia, and other regional markets have different production structures, trade policies, and steel-consuming industries.
Regional averages should not replace country-specific and product-specific research.
10. Excess Capacity: The Defining Structural Risk
One of the most important challenges facing the steel industry is the difference between available production capacity and market demand.
According to the OECD Steel Outlook 2026:
- Global excess steelmaking capacity was estimated at approximately 640 Mt in 2025.
- It could reach 745 Mt by 2028.
- Global nominal steelmaking capacity reached approximately 2,445 Mt in 2025.
The OECD also projected pressure on capacity utilization and profitability.
These estimates describe structural conditions and forecasts. The projected 2028 figure is not a confirmed future result.
Why excess capacity matters
Excess capacity can contribute to:
- Intense competition for orders.
- Pressure on selling prices.
- Lower plant utilization.
- Reduced operating margins.
- Increased export activity.
- More trade remedy investigations.
- Delayed investments or restructuring.
However, global excess capacity does not guarantee local availability of every steel grade.
Technical qualifications, production constraints, transportation costs, and trade measures may still create shortages in specific segments.
The business lesson
Steel companies must distinguish volume growth from profitable growth.
Increasing shipments can weaken financial performance when prices fail to cover operating costs, depreciation, financing, and the capital required to maintain productive assets.
11. Trade Fragmentation and the New Competitive Environment
International steel trade has become increasingly influenced by industrial policy, national security considerations, trade remedies, and environmental requirements.
Important measures include:
- Antidumping duties.
- Countervailing duties.
- Safeguards.
- Tariff-rate quotas.
- National security measures.
- Origin verification.
- Import licensing.
- Sanctions and export restrictions.
These measures do not apply uniformly across all products or countries.
Product scope matters
A measure affecting certain flat-rolled steel products may not apply to long products, stainless steel, or other categories.
Even within the same broad product family, classification, dimensions, chemical composition, and processing characteristics may determine whether a product falls within the scope of a measure.
Avoiding incorrect assumptions
An increase in steel exports does not, by itself, establish dumping.
Antidumping findings depend on applicable legal procedures and evidence concerning dumping, injury, and causal relationships under the relevant framework.
Companies should distinguish market commentary from legally effective determinations.
12. Supply Chain Resilience After COVID-19
The pandemic demonstrated the consequences of limited supply chain visibility and excessive dependence on vulnerable routes or suppliers.
Nevertheless, resilience should not be confused with maintaining maximum inventory.
A resilient supply chain balances continuity, cost, flexibility, and financial exposure.
Supplier diversification
Qualifying alternative suppliers can reduce dependence on a single source.
However, diversification may increase qualification expenses, minimum order quantities, logistical complexity, and quality-control requirements.
Inventory strategy
Additional inventory can protect against delivery disruptions, but it ties up working capital.
Holding more steel also exposes the company to market price declines and storage costs.
Regional sourcing
Nearby suppliers may offer shorter transportation distances and improved coordination.
However, regional sourcing is not automatically cheaper or more reliable.
The analysis must consider actual production capability, financial strength, lead times, technical compliance, and commercial conditions.
13. Quantitative Example: The Cost of Supply Chain Resilience
Consider a hypothetical manufacturer consuming 1,000 tonnes of steel per month.
Its average purchase price is US$700 per tonne.
Management is considering increasing safety stock from one month to one and a half months of consumption.
Current safety stock
1,000 t × US$700/t = US$700,000
Proposed safety stock
1,500 t × US$700/t = US$1,050,000
Additional inventory investment
US$1,050,000 − US$700,000 = US$350,000
Assume a hypothetical inventory carrying cost of 1.0% per month.
The incremental monthly carrying cost would be:
US$350,000 × 1.0% = US$3,500
The simplified annual incremental carrying cost would be:
US$3,500 × 12 = US$42,000
| Indicator | Current policy | Proposed policy |
|---|---|---|
| Safety stock | 1,000 t | 1,500 t |
| Inventory value | US$700,000 | US$1,050,000 |
| Additional capital | — | US$350,000 |
| Incremental monthly carrying cost | — | US$3,500 |
| Incremental annual carrying cost | — | US$42,000 |
The proposed policy may be justified if the expected cost of avoided production interruptions and emergency purchases exceeds the incremental carrying cost and associated risks.
However, the example does not prove that additional inventory is the optimal solution.
Management should also examine supplier diversification, contract flexibility, transportation alternatives, and demand uncertainty.
All figures are hypothetical and exclude changes in steel prices, taxes, and other company-specific costs.
14. Raw Materials and Energy: Persistent Sources of Volatility
Steelmaking costs depend on the production route and the raw materials involved.
Integrated steelmaking commonly relies on iron ore, metallurgical coal, fluxes, energy, and other inputs.
Electric arc furnace operations often depend heavily on ferrous scrap, electricity, electrodes, and alloying materials.
Direct reduced iron production introduces additional exposure to iron ore quality, reducing agents, energy infrastructure, and process conditions.
Why input prices do not translate directly into steel prices
A decline in iron ore prices does not necessarily cause an equivalent decline in finished steel prices.
Steel prices also reflect:
- Demand conditions.
- Capacity utilization.
- Inventory levels.
- Product specifications.
- Regional competition.
- Transportation.
- Contractual pricing arrangements.
- Currency movements.
The relationship between input costs and selling prices may vary over time and between producers.
15. Steel Price Volatility and Commercial Risk Management
Steel prices remain exposed to cyclical and structural forces.
These include raw material markets, industrial demand, capacity changes, geopolitical events, exchange rates, and trade policies.
Digital forecasting tools may improve analytical capabilities, but they cannot eliminate volatility.
Practical risk management instruments
Depending on the company and product, relevant measures may include:
- Formula-based purchasing contracts.
- Price adjustment clauses.
- Inventory limits.
- Multiple qualified suppliers.
- Currency risk management.
- Scenario analysis.
- Futures or other hedging instruments where appropriate.
- Customer price adjustment mechanisms.
Hedging limitations
Financial hedging introduces basis risk, liquidity considerations, counterparty exposure, and possible margin requirements.
A hedge linked to a general HRC benchmark may not perfectly offset the price risk of a specific coated or specialty steel product.
Risk management policies should be based on documented exposure and professional evaluation.
16. Automation and Digital Transformation
Digitalization is one of the important developments in modern steel manufacturing.
However, the adoption of automation varies widely across facilities and production processes.
Relevant technologies
- Industrial sensors and condition monitoring.
- Predictive maintenance.
- Automated material handling.
- Machine vision for quality inspection.
- Advanced process control.
- Digital production dashboards.
- Manufacturing execution systems.
- Robotics.
- Data analytics and artificial intelligence.
The economic test
A digital investment should be evaluated through measurable outcomes.
Potential benefits include reduced unplanned downtime, improved yield, lower rework, better energy management, and more consistent quality.
However, implementation costs, integration requirements, cybersecurity, training, and maintenance must also be considered.
A technology should not be considered successful merely because it incorporates artificial intelligence or connected sensors.
17. The Workforce and Industrial Skills
The modern steel industry requires a combination of metallurgical knowledge, equipment expertise, process engineering, automation, and data interpretation.
Digital transformation can change job responsibilities without eliminating the need for experienced technical professionals.
Important competencies
- Metallurgy and materials engineering.
- Industrial maintenance.
- Automation and control systems.
- Data analysis.
- Process safety.
- Quality assurance.
- Environmental management.
- Cybersecurity awareness.
- Technical documentation.
Training priorities
Companies should align training with actual equipment, operating procedures, and measurable skills gaps.
Remote diagnostics and automation may reduce some manual tasks while increasing the importance of technical troubleshooting and systems integration.
Worker safety remains a central requirement regardless of the level of automation.
18. Decarbonization: A Long-Term Industrial Transformation
Decarbonization has become an important strategic issue for steel producers, governments, and industrial customers.
However, lower-emissions steelmaking involves complex technical and economic trade-offs.
Major production routes
Blast furnace–basic oxygen furnace (BF–BOF)
This integrated route generally uses iron ore and carbon-based reducing agents.
Its emissions profile depends on energy efficiency, raw materials, process configuration, and other factors.
Scrap-based electric arc furnace (EAF)
This route can achieve lower emissions than conventional integrated production under many conditions, particularly with high scrap content and lower-carbon electricity.
However, emissions are not zero.
Direct reduced iron–electric arc furnace (DRI–EAF)
This route may use natural gas or hydrogen-based reducing agents, depending on the facility.
Its environmental performance depends on the reducing agent, electricity, upstream inputs, and operating conditions.
Emissions data must be comparable
Worldsteel’s sustainability indicators show substantial differences among production routes.
For 2024, its expanded greenhouse gas emissions intensity indicator reported approximately:
| Production route | GHG emissions intensity |
|---|---|
| BF–BOF | 2.66 t CO₂e/t crude steel |
| Scrap–EAF | 0.71 t CO₂e/t crude steel |
| DRI–EAF | 1.66 t CO₂e/t crude steel |
These are reported aggregate indicators under a defined methodology, not universal emissions factors for every individual facility.
The figures should not be applied directly to a supplier’s product without verifying its process, accounting boundaries, and available emissions documentation.
For further technical discussion, see Green Steel Technologies: An Engineering Guide to Low-Carbon Steel Production.
19. The EU Carbon Border Adjustment Mechanism in 2026
The European Union’s Carbon Border Adjustment Mechanism, or CBAM, represents an important regulatory development for international trade in selected carbon-intensive goods.
Its transitional phase operated from 2023 through 2025.
The definitive regime began on January 1, 2026.
CBAM covers selected goods in sectors that include iron and steel, aluminum, cement, fertilizers, electricity, and hydrogen.
Why CBAM matters to steel exporters
Companies supplying covered steel products to the EU may need to provide information supporting the determination of embedded emissions.
Importers and authorized declarants have obligations under the applicable regulatory framework.
The precise requirements depend on product coverage, operator status, reporting rules, and the legal provisions in force.
Avoiding common misunderstandings
CBAM is not a universal additional duty on every steel product.
Its scope depends on the relevant goods and regulatory definitions.
It should also not be confused with conventional antidumping duties or safeguards.
Compliance priorities
Exporters and importers should review:
- Product classification.
- Applicable CBAM coverage.
- Installation-level emissions information.
- Relevant calculation methodology.
- Documentation and verification requirements.
- Responsibilities between supplier and importer.
- Current implementing rules.
Regulatory compliance should be verified through the European Commission’s official guidance and applicable legal instruments.
20. Environmental Claims and Product Qualification
The commercial market for lower-emissions steel is developing, but environmental claims must be supported by appropriate evidence.
Terms such as green steel, low-carbon steel, and near-zero-emissions steel can be used differently across commercial initiatives.
A technically credible claim should identify:
- The production facility.
- The steelmaking route.
- The measurement boundary.
- The emissions methodology.
- Relevant emissions categories.
- The reporting period.
- Independent verification, where applicable.
- Product traceability.
Technical performance remains essential
A lower-emissions product must still meet the customer’s mechanical, chemical, dimensional, surface, and application requirements.
Environmental performance does not replace product certification or engineering qualification.
21. Investments, Capacity Expansion and Mergers
Steel investments can involve new production facilities, modernization, energy efficiency, digital technologies, and decarbonization.
However, announced investments should not be confused with completed capacity additions.
Investment development stages
A project may progress through:
- Feasibility assessment.
- Preliminary engineering.
- Financing.
- Regulatory approvals.
- Final investment decision.
- Construction.
- Commissioning.
- Commercial production.
Projects can be delayed, revised, reduced in scope, or cancelled.
Mergers and acquisitions
M&A activity may reflect geographic expansion, restructuring, technology acquisition, or attempts to improve efficiency.
However, consolidation does not automatically increase profitability.
Integration costs, regulatory approvals, market conditions, and the financial structure of a transaction remain important.
22. What Steel Buyers Should Do Differently
Industrial buyers should use market intelligence to improve purchasing decisions rather than react mechanically to headlines.
Recommended priorities
Understand total delivered cost
Compare steel prices on equivalent specifications and commercial terms.
Qualify suppliers
Review technical capability, quality systems, delivery performance, and financial reliability.
Monitor regulatory exposure
Identify applicable import duties, trade remedies, origin requirements, and documentation.
Manage inventory economically
Balance supply continuity against carrying costs and market risk.
Use scenario analysis
Evaluate the consequences of changes in prices, exchange rates, lead times, and demand.
Coordinate purchasing with production
Avoid decisions that optimize purchase prices while creating operational disruptions.
23. What Steel Producers and Distributors Should Prioritize
Producers and distributors face different commercial pressures but share a need for disciplined management.
Producers
Important priorities include:
- Capacity utilization.
- Product yield.
- Energy consumption.
- Maintenance performance.
- Quality consistency.
- Product mix.
- Working capital.
- Customer qualification.
- Environmental performance.
Distributors
Important priorities include:
- Inventory turnover.
- Stock availability.
- Price exposure.
- Supplier diversification.
- Credit risk.
- Customer service.
- Logistics efficiency.
- Product traceability.
A strategy focused exclusively on sales volume can undermine profitability if inventory losses, financing costs, and operating expenses are not adequately controlled.
24. Scenario Analysis: Three Possible Market Conditions
The steel industry should not be evaluated through a single deterministic forecast.
A practical planning process can consider several possible environments.
| Scenario | Main characteristics | Business response |
|---|---|---|
| Gradual recovery | Moderate demand improvement, manageable input costs | Selective investment and inventory discipline |
| Persistent oversupply | Weak prices, strong export competition, low utilization | Cost control, product differentiation and margin protection |
| Supply or energy shock | Higher input costs, logistical disruption, delivery uncertainty | Contingency planning, supplier alternatives and cash-flow protection |
These are illustrative scenarios, not assigned probabilities or predictions.
Gradual recovery
Under this scenario, demand strengthens without major disruptions.
Companies may benefit from improving utilization and more predictable order volumes.
However, excess capacity could still constrain margins.
Persistent oversupply
Under this scenario, capacity expansion and weak demand maintain pressure on selling prices.
Businesses may need to prioritize operating efficiency, working capital, and differentiated products.
Supply or energy shock
Under this scenario, energy costs, transportation disruptions, or geopolitical events create operational uncertainty.
Businesses with qualified alternatives and disciplined risk management may be better positioned to maintain continuity.
25. Quantitative Example: Price Pressure and Operating Margin
Consider a hypothetical steel distributor selling 2,000 tonnes per month.
Its initial selling price is US$800 per tonne, and its purchase cost is US$740 per tonne.
For simplicity, the example excludes operating expenses, taxes, financing, and inventory valuation adjustments.
Initial gross trading spread
US$800 − US$740 = US$60/t
Monthly gross trading contribution:
2,000 × US$60 = US$120,000
Now suppose the selling price declines by 5%, while purchase costs remain unchanged.
Revised selling price
US$800 × 0.95 = US$760/t
Revised gross trading spread
US$760 − US$740 = US$20/t
Monthly gross trading contribution:
2,000 × US$20 = US$40,000
| Indicator | Initial scenario | Lower-price scenario |
|---|---|---|
| Monthly sales volume | 2,000 t | 2,000 t |
| Selling price | US$800/t | US$760/t |
| Purchase cost | US$740/t | US$740/t |
| Gross trading spread | US$60/t | US$20/t |
| Monthly gross trading contribution | US$120,000 | US$40,000 |
A 5% selling-price decline reduces the simplified monthly gross trading contribution by 66.7%.
The example illustrates how modest price movements can have disproportionately large effects on low-margin steel trading operations.
It also explains why inventory valuation, contract terms, and purchasing discipline are critical during periods of oversupply.
26. The Most Important Indicators to Monitor Through 2027
Companies should establish a manageable set of indicators aligned with their exposure.
| Area | Recommended indicators | Strategic relevance |
|---|---|---|
| Demand | Apparent steel use, industrial production, construction | Sales planning |
| Production | Crude steel output, mill utilization | Supply conditions |
| Capacity | Announced, underway and operating capacity | Structural competition |
| Prices | Relevant finished steel benchmarks | Purchasing and sales |
| Raw materials | Scrap, iron ore, metallurgical coal, electricity | Cost exposure |
| Trade | Import and export volumes, trade remedies | Market access |
| Logistics | Freight, lead times, port disruptions | Supply continuity |
| Finance | Exchange rates, interest rates, working capital | Profitability |
| Sustainability | Emissions requirements, CBAM developments | Compliance |
| Technology | Operating results of industrial investments | Competitiveness |
Monitoring frequency
Critical operational developments may require immediate review.
Price-sensitive businesses may monitor selected indicators daily.
Broader market and financial trends may be reviewed weekly or monthly.
For a complete methodology, see How to Track Steel Industry News: Sources, Price Signals and Market Intelligence.
27. Frequently Asked Questions
Has the global steel industry fully recovered from COVID-19?
The pandemic-related disruption has largely transitioned into a different set of market challenges. However, recovery varies by region and product. Weak demand, excess capacity, and trade pressures mean that a universal claim of full recovery would be misleading.
What is the global steel demand forecast for 2026?
Worldsteel’s April 2026 outlook projected global finished steel demand of 1,724 million tonnes in 2026, representing growth of 0.3%. This is a forecast, not a confirmed annual result.
What is the forecast for 2027?
The same worldsteel outlook projected demand of 1,762 million tonnes in 2027, representing growth of 2.2%. Actual outcomes may differ.
What is the greatest structural risk facing steel producers?
Persistent excess capacity is a major structural concern because it can weaken utilization, prices, and profitability. The importance of this risk varies by product and market.
Why is China so important to international steel prices?
China’s scale of production, domestic consumption, and exports means that changes in its market can influence international competition and trade flows.
Is India expected to continue growing?
Worldsteel’s April 2026 outlook projected strong Indian steel demand growth in both 2026 and 2027. However, forecasts are subject to economic and policy uncertainty.
Will steel prices become less volatile after the pandemic?
There is no reliable basis for assuming that volatility will necessarily decline. Steel prices remain exposed to demand, capacity, raw materials, energy, logistics, currency, and geopolitical conditions.
Does electric arc furnace production always have lower emissions?
Not necessarily in every case. Emissions depend on the metallic charge, electricity mix, upstream inputs, and accounting methodology. Scrap-based EAF production often has a lower emissions intensity than conventional integrated steelmaking, but individual facilities must be evaluated.
What changed with EU CBAM in 2026?
CBAM entered its definitive regime on January 1, 2026. Selected iron and steel products are covered, with obligations governed by the applicable EU rules.
Are trade tariffs the same for all steel products?
No. Applicable measures depend on product scope, classification, origin, effective dates, and the relevant legal framework.
Should steel buyers increase inventory to protect against disruptions?
Only when the expected benefits justify the additional capital, carrying costs, and market risks. Supplier alternatives and contractual measures may offer other solutions.
Can artificial intelligence eliminate steel production disruptions?
No. AI can support predictive maintenance, quality analysis, and operational monitoring, but it cannot eliminate equipment failures, supply shocks, or market uncertainty.
Does growing steel demand guarantee better producer profitability?
No. Profitability also depends on capacity utilization, competition, input costs, selling prices, operating efficiency, and financing.
Is low-carbon steel automatically more expensive?
Not necessarily under every commercial condition. Cost differences depend on technology, energy, raw materials, capital expenditure, carbon policies, and customer requirements.
Which regions are most important for future steel demand?
China remains critical because of its scale, while India and other developing markets are important sources of potential growth. Regional prospects differ substantially.
How should a small steel distributor prepare for market uncertainty?
A distributor should focus on inventory discipline, reliable suppliers, credit control, product-specific price monitoring, and realistic purchasing scenarios.
What should companies monitor most closely in 2027?
Important indicators include regional demand, capacity additions, steel prices, raw materials, trade measures, energy conditions, and environmental compliance requirements.
28. Conclusion
The global steel industry after COVID-19 is not simply returning to its previous operating model.
The pandemic exposed vulnerabilities in supply chains and accelerated attention to operational resilience and digital capabilities.
However, the industry’s most important challenges in 2026 are increasingly structural.
Excess steelmaking capacity, uneven regional demand, international trade restrictions, energy exposure, and decarbonization requirements are reshaping competitive conditions.
Worldsteel’s demand forecasts suggest the possibility of stronger global growth in 2027, but the OECD’s capacity outlook highlights continued pressure on profitability and utilization.
Both developments can occur simultaneously.
For steel producers, distributors, importers, and industrial buyers, the strategic response should combine technical competence with financial discipline.
The most resilient businesses will not necessarily be those that produce or purchase the largest volumes.
They will be those that understand their markets, manage costs and working capital, verify regulatory obligations, qualify suppliers, and invest selectively in technologies that deliver measurable improvements.
The post-pandemic steel industry should therefore be understood as an industry undergoing structural adjustment rather than one experiencing a uniform recovery.
29. Technical References
The following institutional sources support the market statistics, forecasts, regulatory information, and technical principles discussed in this article. Historical figures and projections should always be distinguished.
- World Steel Association — Short Range Outlook, April 2026. Official global and regional steel demand forecasts for 2026 and 2027.
- World Steel Association — Annual Crude Steel Production Database. Historical crude steel production statistics, including the updated 2025 global total.
- World Steel Association — 2025 Global Crude Steel Production Release. Initial annual release and country-level production comparisons. Figures may differ from subsequently revised databases.
- OECD — Steel Outlook 2026. Global capacity, excess capacity, demand, trade, and profitability analysis.
- OECD — Global Steelmaking Capacity Reaches New Highs. Detailed assessment of capacity expansion and utilization.
- OECD — International Efforts to Address the Steel Crisis. Trade, excess capacity, and industrial policy developments.
- European Commission — Carbon Border Adjustment Mechanism. Official overview of CBAM and its definitive regime.
- European Commission — CBAM Definitive Regime. Current framework and obligations applicable from 2026.
- European Commission — CBAM Sectors. Sector-specific guidance, including iron and steel.
- World Steel Association — Sustainability Indicators. Greenhouse gas emissions intensity and production-route indicators.
- World Steel Association — Climate Change and the Production of Iron and Steel. Technical discussion of steelmaking routes, emissions, and decarbonization.
Editorial note: This article reflects information available through October 10, 2026. Forecasts are conditional estimates, not guaranteed outcomes. Financial examples are hypothetical and do not constitute individualized investment or commercial advice. Tariff, customs, and environmental obligations must be verified for the specific transaction and applicable date.