
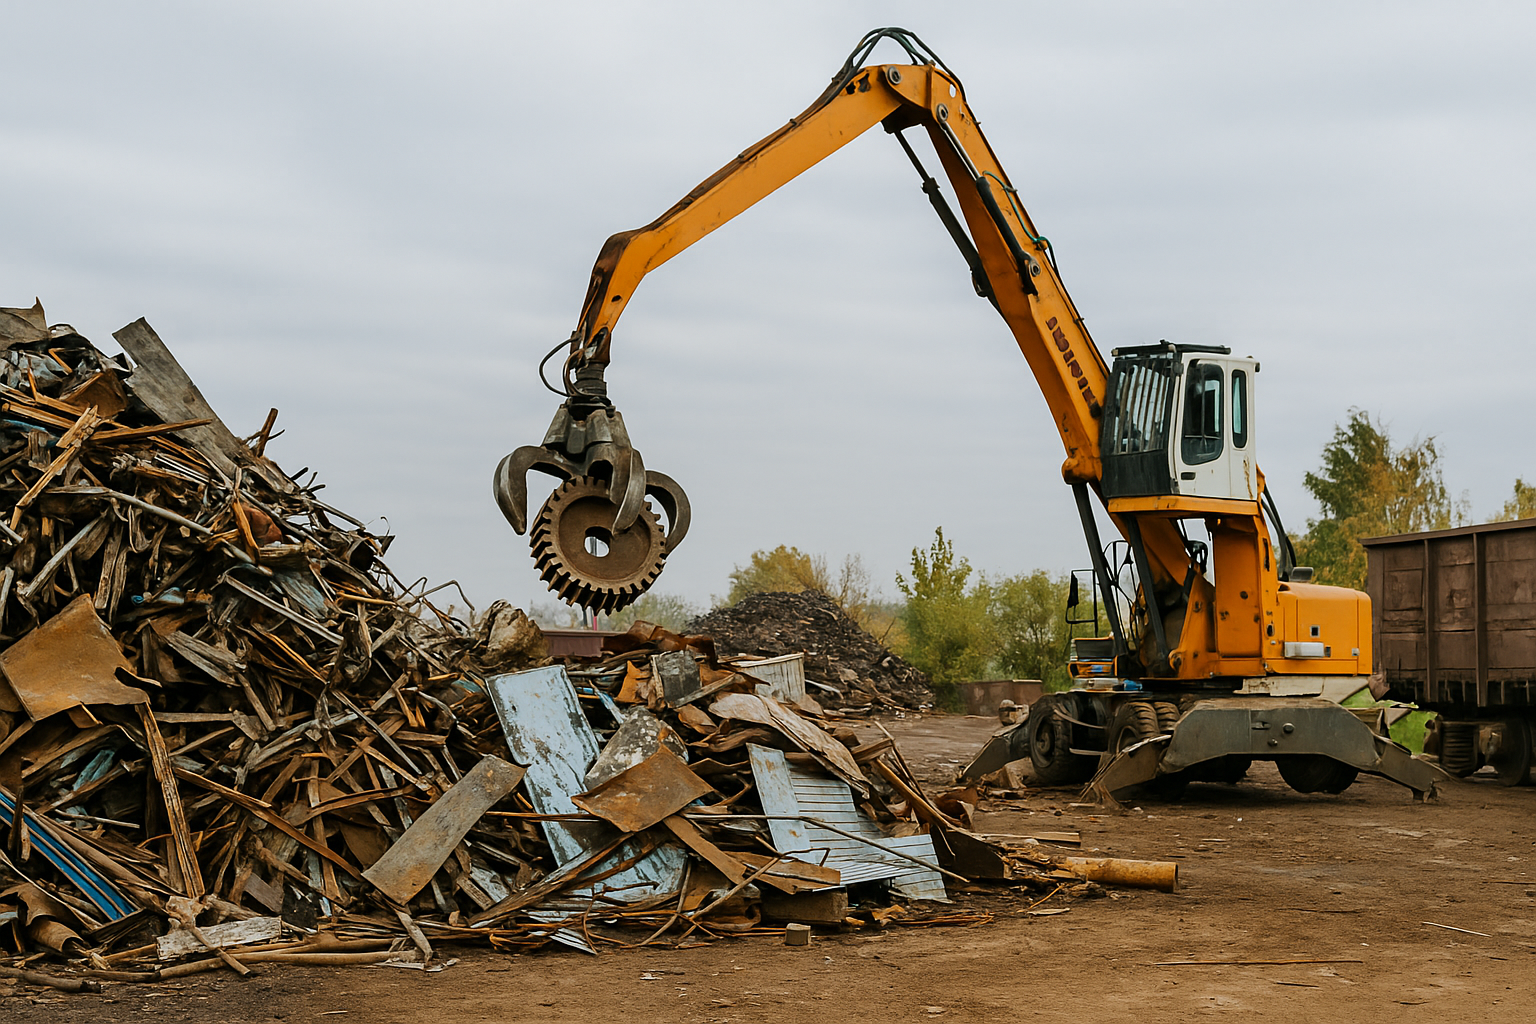
Steel scrap is often treated as an unavoidable consequence of manufacturing.
A company buys steel, processes it, manufactures its products, sells the generated scrap, and records the scrap revenue. Because scrap still has commercial value, it can easily be perceived as a normal — and sometimes relatively harmless — part of production.
That interpretation can hide a significant source of cost.
For a steel-consuming manufacturer, scrap represents steel that was purchased but did not become part of an approved finished product.
And before becoming scrap, that steel may already have accumulated freight, receiving, storage, cutting, forming, labor, energy, tooling, inspection, and other manufacturing costs.
Selling the scrap recovers only part of that value.
This leads to a fundamental principle:
The primary objective of scrap management should not be to maximize scrap sales. It should be to prevent purchased steel from becoming scrap whenever technically and economically possible — and then maximize the value recovered from the scrap that cannot be avoided.
This article presents a practical methodology for reducing steel costs through material-yield improvement, cutting and nesting optimization, purchasing-specification review, process control, scrap segregation, traceability, and financial measurement.
The ultimate objective is not simply a lower scrap percentage.
It is a lower:
Steel Cost per Approved Finished Product.
1. Scrap Management Should Begin Before Scrap Is Generated
Traditional scrap management often begins when scrap reaches a container.
At that point, however, one of the most important economic opportunities has already been lost.
The material has already been purchased.
It may already have been transported, stored, cut, stamped, formed, welded, painted, inspected, or otherwise processed.
Therefore, an effective scrap-management system should begin much earlier:
Steel Purchasing → Material Specification → Product Design → Sheet/Coil Dimensions → Nesting/Cutting → Process Control → Scrap Generation → Segregation → Traceability → Recovery → Recycling → Continuous Improvement
This changes scrap management from a waste-handling activity into an industrial material-efficiency program.
2. Scrap Reduction and Scrap Recovery Are Different Objectives
These two concepts should never be confused.
Scrap Reduction
The objective is to prevent steel from becoming scrap.
Examples include:
- improving nesting;
- optimizing blank dimensions;
- selecting better coil widths;
- reducing quality rejects;
- controlling setup losses;
- improving process capability;
- reusing suitable remnants.
Scrap Recovery
The scrap already exists.
The objective is now to preserve and maximize its residual commercial value through:
- segregation;
- identification;
- contamination control;
- proper storage;
- weighing;
- commercial negotiation;
- appropriate recycling channels.
Both activities are important.
But economically:
Preventing avoidable scrap normally preserves more value than generating scrap and selling it efficiently.
3. Scrap Revenue Is Cost Recovery — Not Cost Reduction
Suppose a company purchases steel at:
US$900/t
and later sells the generated scrap at:
US$300/t.
Every tonne converted into scrap creates a direct material-value difference of:
US$600/t
before considering any additional processing costs.
Receiving US$300 for that tonne is certainly better than receiving nothing.
But the company should not interpret the US$300 as evidence that the scrap operation was economically successful.
It recovered only part of the original value.
This distinction becomes particularly important when scrap sales appear as revenue in financial reports.
A factory can have an excellent scrap-selling operation while simultaneously having poor material utilization.
4. The Real Cost of Scrap Is Greater Than the Difference Between Steel and Scrap Prices
The simplest direct-material calculation is:
Gross Material Loss = Scrap Mass × Steel Purchase Cost
Then:
Scrap Recovery Value = Scrap Mass × Scrap Selling Price
And:
Net Direct Material Loss = Gross Material Loss − Scrap Recovery Value
But this is only the beginning.
Steel can accumulate costs as it moves through production:
Purchase → Freight → Receiving → Storage → Cutting → Forming → Welding → Finishing → Inspection
Consequently:
The economic cost of scrap depends not only on how much steel was lost, but also on when in the manufacturing process the loss occurred.
This is a crucial distinction.
5. Ten Kilograms of Scrap Can Have Very Different Economic Costs
Consider two 10 kg losses.
Situation A — Cutting Off-Cut
Ten kilograms remain after a sheet-cutting operation.
The loss may include:
- steel purchase cost;
- freight;
- receiving;
- storage;
- cutting.
Situation B — Finished Component Rejected at Final Inspection
The same 10 kg of steel becomes a component that is subsequently rejected.
It may already contain:
- steel purchase cost;
- freight;
- cutting;
- stamping;
- forming;
- welding;
- consumables;
- labor;
- machine time;
- energy;
- surface treatment;
- inspection.
Both situations may ultimately add 10 kg to the scrap report.
Economically, they are not equivalent.
This is why an advanced scrap system should classify not only how much scrap was generated, but also where and why it was generated.
6. Material Yield Is One of the Most Important Indicators
A useful starting KPI is:
Material Yield (%) = Approved Product Steel Mass / Processed Steel Mass × 100
Suppose:
- Steel processed = 500 t
- Steel incorporated into approved products = 450 t
Then:
Material Yield = 450 / 500 × 100 = 90%
Corresponding material loss:
10%
However, the 10% should not automatically be classified as waste that can be eliminated.
Some losses are technically inherent.
The correct question is:
What is the technically and economically achievable material yield for this specific product and manufacturing process?
7. Scrap Rate Complements Material Yield
A simplified scrap-rate calculation is:
Scrap Rate (%) = Scrap Mass / Processed Steel Mass × 100
If 500 tonnes are processed and 50 tonnes become scrap:
Scrap Rate = 50 / 500 × 100 = 10%
Material yield and scrap rate provide useful high-level information.
But neither explains the root cause.
A company needs to go further.
8. Separate Technically Inherent Scrap From Avoidable Scrap
This distinction is fundamental.
Technically Inherent Scrap
Depending on the process, some material loss may be necessary:
- cutting kerf;
- holes;
- edge trimming;
- stamping skeleton;
- required process margins;
- test specimens;
- coil head and tail losses;
- certain blanking losses.
Potentially Avoidable Scrap
Other losses may result from:
- inefficient nesting;
- unsuitable sheet dimensions;
- unsuitable coil widths;
- excessive blank dimensions;
- obsolete specifications;
- setup instability;
- process defects;
- damaged material;
- poor storage;
- incorrect material identification;
- lack of remnant reuse;
- quality rejects.
The objective is not necessarily zero scrap.
The objective is:
minimum technically and economically justified scrap.
9. Stage 1 — Establish the Current Material Baseline
Before changing anything, document the current condition.
For each high-consumption product or product family, collect:
- steel grade;
- thickness;
- coating, when applicable;
- sheet dimensions;
- coil width;
- supplier;
- annual purchased quantity;
- processed quantity;
- approved finished-product mass;
- scrap mass;
- scrap rate;
- material yield;
- purchase price;
- scrap recovery price;
- freight;
- major processing steps;
- principal scrap causes.
A representative historical period should be used whenever possible.
Without a baseline, improvement cannot be reliably demonstrated.
10. Stage 2 — Build a Scrap Map
Total factory scrap is useful for accounting.
It is insufficient for engineering.
Scrap should be mapped through a hierarchy such as:
Factory → Product Family → Product → Process → Machine → Shift → Scrap Cause
For example, a plant generating 500 tonnes of scrap annually might discover:
- 160 t — cutting/nesting losses;
- 95 t — stamping skeleton;
- 75 t — coil-width mismatch;
- 60 t — quality rejects;
- 45 t — setup/start-up;
- 35 t — unused remnants;
- 30 t — miscellaneous causes.
The same 500 tonnes now become an actionable engineering database.
11. Stage 3 — Use Pareto Analysis Before Starting Projects
Not every scrap problem deserves the same engineering effort.
A Pareto analysis can rank losses by:
- tonnes/year;
- US$/year;
- product;
- process;
- machine;
- cause;
- steel family.
A factory may discover that three products generate 55% of the avoidable material loss.
Those products should normally be investigated before dozens of low-volume components.
This is the same principle used in ABC analysis:
prioritize where engineering effort creates the greatest economic return.
12. Stage 4 — Review Product Design
Scrap reduction can begin at the drawing board.
Product geometry influences:
- blank shape;
- nesting;
- holes;
- cutouts;
- trim;
- orientation;
- required margins;
- manufacturing sequence.
Engineering should ask:
- Can the geometry be modified without affecting function?
- Can two components share common dimensions?
- Can part orientation improve nesting?
- Can a reinforcement be redesigned?
- Can multiple components be integrated?
- Are historical dimensions still technically necessary?
The objective is not to compromise product performance.
It is to eliminate steel that does not contribute to approved product performance.
13. Stage 5 — Review the Cutting Plan
In sheet and plate processing, cutting plans are frequently among the largest opportunities.
A cutting plan should consider:
- part orientation;
- nesting;
- combination of different components;
- sheet dimensions;
- kerf;
- edge requirements;
- minimum spacing;
- rolling direction where relevant;
- machine limitations;
- handling;
- production sequence;
- remnant generation;
- remnant reuse.
Modern nesting software can help enormously.
But software optimizes within the constraints it receives.
If the purchased sheet dimensions themselves are inefficient, even excellent nesting software may optimize the wrong starting condition.
14. The Best Cutting Plan May Begin With Purchasing
This is one of the most important principles in the methodology:
Some scrap is created by the purchasing specification before the steel reaches the machine.
Production may already have optimized the nesting within a standard 1,500 × 3,000 mm sheet, for example.
But what if another commercially feasible sheet dimension provides significantly better utilization?
The optimization problem therefore becomes:
Product Geometry + Cutting Plan + Sheet Dimensions + Supplier Capability + Annual Volume + Total Cost
Purchasing must participate.
15. Coil Width Is a Strategic Material-Efficiency Variable
The same logic becomes particularly important for coils.
A small continuous edge loss can become enormous over thousands of meters.
For coil-fed processes, evaluate:
- finished component width;
- number of strips across the coil;
- slit widths;
- edge trimming;
- width tolerance;
- process margins;
- supplier capability;
- annual volume.
The historical coil width should never automatically be treated as optimal.
A change of only a few millimeters can sometimes produce substantial annual savings when consumption is high.
16. Thickness Is Also Part of Scrap Economics
Scrap analysis normally focuses on area or mass utilization.
But thickness matters as well.
Suppose two technically acceptable steel supplies have different actual average thicknesses.
If the company purchases material systematically above what the product function requires, every square meter contains additional mass.
Part of that extra steel becomes product.
Part may become scrap.
Therefore, the company can:
buy additional steel → pay freight on it → process it → generate scrap from it → sell part of it back at scrap value.
This is why scrap management connects directly with thickness tolerance management.
Thickness optimization and cutting optimization should not be treated as isolated programs.
They are both parts of material yield management.
17. Do Not Reduce Thickness Only to Reduce Scrap Cost
An important technical warning is necessary.
A lower thickness cannot be selected simply because it reduces purchased mass or scrap mass.
The finished product must still satisfy:
- strength;
- stiffness;
- buckling;
- fatigue;
- formability;
- weldability;
- impact requirements;
- dimensional performance;
- safety requirements;
- applicable standards.
Material efficiency must always remain subordinate to validated product performance.
18. Stage 6 — Optimize Blank Dimensions
Stamped components deserve special attention.
A blank established years ago may still contain margins based on:
- older tooling;
- previous steel grades;
- conservative assumptions;
- obsolete process conditions.
Review:
- blank width;
- blank length;
- strip pitch;
- carrier design;
- draw allowance;
- trim allowance;
- forming behavior;
- tool condition;
- actual process capability.
A few millimeters saved per blank can become many tonnes annually in high-volume production.
19. Stage 7 — Improve Nesting
For laser, plasma, oxy-fuel, punching, and other cutting operations, nesting optimization may consider:
- rotation;
- part mixing;
- common-line cutting where technically feasible;
- spacing;
- kerf;
- production batches;
- machine restrictions;
- remnant geometry.
However:
Maximum nesting efficiency is not automatically minimum manufacturing cost.
A complicated nesting plan may save steel while increasing:
- machine time;
- programming;
- handling;
- sorting;
- scheduling complexity;
- error risk.
The optimum is a total-cost optimum.
20. Stage 8 — Control Setup and Start-Up Scrap
Setup scrap is often considered unavoidable.
Some of it may indeed be necessary.
But it should still be measured.
Compare:
- machines;
- shifts;
- operators;
- products;
- steel grades;
- thicknesses;
- tools.
If one process needs 12 pieces to stabilize while a similar process requires four, the difference deserves investigation.
Potential causes include:
- tooling;
- machine condition;
- work instructions;
- operator training;
- process parameters;
- material variation.
21. Stage 9 — Attack Quality-Related Scrap Separately
Quality rejects should not disappear inside a generic scrap number.
Examples include:
- dimensional nonconformity;
- cracks;
- excessive springback;
- surface defects;
- welding failures;
- coating damage;
- wrong material;
- traceability loss.
These losses should be connected to the corresponding quality-management and process-control systems.
A fully processed rejected component can be far more expensive than a simple cutting off-cut.
22. Process Capability Can Reduce Scrap
A stable process can operate closer to the technical target without excessive safety margins.
This connects scrap management with:
- statistical process control;
- measurement-system analysis;
- Cp;
- Cpk;
- process centering;
- variation reduction.
If a process is unstable, engineering may compensate with larger blanks, wider margins, additional trimming, or conservative dimensions.
Reducing variability can therefore create material-saving opportunities.
23. Supplier Capability Can Affect Scrap Generation
Scrap is not always caused internally.
Supplier-related characteristics may influence manufacturing yield:
- thickness variation;
- width variation;
- flatness;
- camber;
- surface condition;
- coating quality;
- mechanical-property variation;
- dimensional consistency;
- packaging damage.
This creates an important procurement lesson:
The steel with the lowest price per tonne is not necessarily the steel with the lowest cost per approved finished product.
Supplier evaluation should include manufacturing performance.
24. Stage 10 — Recover Technically Suitable Remnants
Not every off-cut should immediately become scrap.
Some remnants may be reused.
A remnant-management system can identify:
- grade;
- thickness;
- coating;
- dimensions;
- heat/batch when required;
- storage location;
- potential application.
However, keeping every piece is not good management.
The company should establish minimum economic criteria.
Otherwise, remnant recovery becomes uncontrolled inventory.
25. Remnants Have Carrying Costs
A remnant has material value, but storing it also creates costs:
- floor space;
- racks;
- handling;
- identification;
- inventory control;
- corrosion risk;
- searching time;
- obsolescence.
Therefore:
Potential Reuse Value > Cost of Maintaining the Remnant
should be the underlying economic logic.
This prevents the factory from becoming a warehouse of pieces that will never be used.
26. Stage 11 — Segregate Unavoidable Scrap
Once scrap cannot economically be prevented or reused, preserve its recycling value.
Depending on the operation, segregation may include:
- carbon steel;
- stainless steel;
- galvanized steel;
- Al-Zn coated steel;
- alloy steel;
- clean sheet skeletons;
- heavy scrap;
- light scrap;
- turnings/chips.
Mixing different materials may reduce recovery value.
Contamination can create additional penalties.
Scrap segregation is therefore both a commercial and metallurgical issue.
27. Traceability Should Continue Into the Scrap Stream
The scrap container should not be an information black hole.
Where economically practical, the company should be able to identify:
Product → Process → Machine → Cause → Material → Quantity
This can begin simply with:
- dedicated containers;
- reason codes;
- identification tags;
- scales;
- spreadsheets;
- production records.
More sophisticated systems may later integrate:
- ERP;
- MES;
- barcode;
- RFID;
- automated weighing;
- production dashboards.
Digitalization should follow process understanding — not replace it.
28. Stage 12 — Calculate Net Scrap Loss
A useful direct-material indicator is:
Net Scrap Loss = Original Material Value of Scrap − Scrap Recovery Value
For example:
Scrap = 100 t
Steel purchase cost = US$900/t
Scrap selling price = US$300/t
Original material value:
100 × 900 = US$90,000
Recovery:
100 × 300 = US$30,000
Net direct material loss:
US$60,000
This does not yet include accumulated processing cost.
Therefore, for important scrap categories, the company should consider a second level of analysis.
29. Introduce Scrap Cost by Process Stage
A practical costing hierarchy can classify scrap according to the stage where it occurs.
For example:
Level 1 — Raw Material Scrap
Material + inbound logistics.
Level 2 — Cutting Scrap
Material + logistics + cutting.
Level 3 — Forming Scrap
Material + logistics + cutting + forming.
Level 4 — Assembly Scrap
Material + all previous operations + assembly.
Level 5 — Finished-Product Reject
Material + almost the entire manufacturing conversion cost.
This does not require perfect accounting precision.
Even an approximate stage-cost model can dramatically improve prioritization.
30. Use Scrap Cost per Approved Finished Unit
A powerful KPI is:
Scrap Cost per Approved Finished Unit
This connects scrap directly with output.
Another useful indicator is:
Steel Cost per Approved Finished Product
These measures prevent a common management error.
A plant can reduce scrap percentage while producing fewer approved products, increasing processing cost, or creating another hidden loss.
The real objective is profitable approved output.
31. Material Utilization Rate
For cutting-intensive processes, another useful KPI is:
Material Utilization Rate (%) = Net Part Area or Mass / Input Sheet or Coil Area or Mass × 100
This can be measured for:
- individual nests;
- products;
- product families;
- machines;
- sheets;
- coils.
Material utilization provides a more specific view of geometric efficiency than overall plant scrap rate.
32. Scrap Value Recovery Rate
Commercial performance can be measured separately.
One possible indicator is:
Scrap Value Recovery Rate = Actual Scrap Revenue / Reference Recoverable Scrap Value
The precise definition should be adapted to the company’s accounting and scrap market.
The important principle is to separate:
Manufacturing performance
from:
Scrap-sales performance.
A company needs both.
33. First-Pass Yield Can Reveal Hidden Scrap Costs
Where applicable, First-Pass Yield (FPY) can complement scrap indicators.
A component that requires rework may not immediately become scrap.
But repeated rework can eventually:
- consume labor;
- use energy;
- occupy machines;
- damage components;
- generate final rejection.
Therefore, scrap reduction should be connected to broader manufacturing-quality indicators rather than treated as an isolated recycling metric.
34. Build a Scrap Management Dashboard
A practical dashboard can include:
| KPI | Management Purpose |
|---|---|
| Material Yield (%) | Steel converted into approved product |
| Scrap Rate (%) | Overall material loss |
| Material Utilization (%) | Geometric/cutting efficiency |
| Scrap kg per Product | Product comparison |
| Scrap by Cause | Root-cause prioritization |
| Scrap by Machine | Process prioritization |
| Scrap by Process Stage | Economic severity |
| Scrap Recovery Value | Commercial recovery |
| Net Scrap Loss | Direct financial loss |
| Reusable Remnant Rate | Internal material recovery |
| First-Pass Yield | Process-quality performance |
| Steel Cost per Approved Product | Final economic performance |
The dashboard should drive decisions, not simply produce reports.
35. Use ABC Analysis to Prioritize Projects
A steel-consuming manufacturer may have thousands of parts.
Optimizing all of them simultaneously makes little sense.
Classify opportunities according to:
- annual steel consumption;
- annual scrap mass;
- annual scrap cost;
- production volume;
- purchasing value;
- improvement potential.
A Items
High financial impact — immediate engineering analysis.
B Items
Medium impact — second wave.
C Items
Low impact — selective analysis or monitoring.
A 1% yield improvement on a major product family can be more valuable than a 30% improvement on a low-volume component.
36. Purchasing Must Participate
Scrap is not exclusively a production problem.
Purchasing decisions affect:
- sheet dimensions;
- coil widths;
- slit widths;
- blank supply;
- tolerance;
- supplier capability;
- packaging;
- minimum order quantities;
- service-center options.
Purchasing should therefore move beyond:
US$/tonne
toward:
US$/approved finished product.
37. Steel Service Centers Can Become Material-Efficiency Partners
Service centers can sometimes provide:
- custom widths;
- slit coils;
- cut-to-length sheets;
- optimized blanks;
- special sheet formats;
- batch combinations;
- preprocessing.
The processing charge may increase.
Internal scrap may decrease substantially.
Therefore, compare:
Option A — Lower steel/service price + higher internal scrap
with:
Option B — Higher preprocessing cost + higher material yield
using total cost.
38. Engineering, Purchasing, Production and Quality Must Work Together
Scrap reduction is inherently cross-functional.
Engineering
Product geometry, specifications, tolerances, blanks, technical validation.
Purchasing
Supplier capability, dimensions, commercial conditions, service-center solutions.
Production
Actual losses, setup, operating parameters, industrial validation.
Quality
Product conformity, defect causes, measurement systems, process capability.
Planning
Batch combinations, production sequencing, nesting opportunities.
Logistics
Material movement, remnant handling, scrap storage.
Finance / Controlling
Savings validation and cost modeling.
Suppliers
Alternative dimensions, tolerances, processing and technical support.
Local optimization should never increase total-system cost.
39. A Simplified Industrial Business Case
Consider an illustrative manufacturer processing:
2,000 t/year
Current material yield:
88%
Approved product mass:
1,760 t
Current scrap:
240 t
After optimizing:
- cutting plans;
- coil widths;
- blank dimensions;
- process stability;
- remnant reuse;
material yield improves to:
91%
To produce the same 1,760 tonnes of approved product:
Required Steel Input = 1,760 / 0.91 ≈ 1,934 t
Potential reduction in steel purchasing:
2,000 − 1,934 = approximately 66 t/year
At:
US$900/t
gross purchasing reduction:
≈ US$59,400/year
If the avoided scrap would have been sold at:
US$300/t
lost scrap revenue:
≈ US$19,800/year
Simplified net direct-material benefit:
US$59,400 − US$19,800 = approximately US$39,600/year
And this calculation still excludes possible savings from:
- inbound freight;
- handling;
- inventory;
- processing;
- scrap transportation;
- storage;
- administrative work.
The example is illustrative. Actual savings must be calculated from the company’s real operating data.
40. Connect Scrap Reduction With Thickness Tolerance Management
Material optimization should not be fragmented into isolated projects.
Consider a sheet component.
Its steel consumption is influenced by:
Area × Actual Thickness × Density
Cutting optimization attacks unnecessary area.
Thickness-tolerance optimization attacks unnecessary thickness.
Process-quality improvement attacks unnecessary rejected output.
Together they determine how much purchased steel becomes approved product.
This leads to a broader concept:
Material Yield Management
rather than simply scrap management.
41. Common Mistake: Celebrating High Scrap Revenue
A higher scrap-sales figure may result from:
- better selling prices;
- higher scrap generation;
- higher production;
- better segregation.
These situations have completely different meanings.
Scrap revenue should always be interpreted together with:
- steel processed;
- approved output;
- material yield;
- scrap rate;
- scrap recovery price.
High scrap revenue by itself is not a manufacturing KPI.
42. Common Mistake: Measuring Scrap Only in Tonnes
Tonnes are important.
But they do not show economic severity.
Ten tonnes of early-stage cutting scrap and ten tonnes of final-product rejects can represent very different financial losses.
Track:
Mass + Cause + Process Stage + Economic Cost
wherever practical.
43. Common Mistake: Treating Historical Dimensions as Optimal
Sheet size, coil width, blank dimensions, and process margins are often inherited from previous projects.
They may have been correct when originally defined.
That does not prove they remain optimal today.
Changes in:
- suppliers;
- steel grades;
- equipment;
- tooling;
- volumes;
- nesting software;
- process capability;
may create new opportunities.
Historical specifications should be periodically challenged with engineering evidence.
44. Common Mistake: Storing Every Remnant
Material recovery can become inventory waste.
Define:
- minimum dimensions;
- maximum storage period;
- identification requirements;
- approved applications;
- disposal rules.
The objective is profitable reuse — not accumulation.
45. Common Mistake: Optimizing Scrap at the Expense of Productivity
A nesting arrangement may improve material utilization while significantly reducing machine throughput.
A custom material dimension may reduce scrap while increasing lead time or minimum order quantity.
A remnant-reuse system may save steel while creating excessive handling.
Every project should therefore evaluate:
Material + Processing + Inventory + Logistics + Quality + Productivity
The objective is total cost.
46. Common Mistake: Implementing Changes Without Industrial Validation
Never assume that a theoretical improvement is automatically suitable for production.
Changes to:
- steel grade;
- thickness;
- blank;
- sheet dimension;
- coil width;
- nesting;
- process parameters;
may affect manufacturing or finished-product performance.
Use controlled industrial trials.
Validate the finished product, not merely the material-saving calculation.
47. Create a Formal Scrap-Reduction Project
A practical project sequence is:
1. Select high-impact products
2. Establish the baseline
3. Map scrap by cause
4. Separate inherent and avoidable losses
5. Review product geometry
6. Review material specification
7. Review sheet/coil dimensions
8. Optimize nesting and blanks
9. Evaluate process capability
10. Evaluate supplier capability
11. Conduct industrial trials
12. Validate finished products
13. Calculate financial savings
14. Standardize
15. Monitor
This turns isolated improvement ideas into a repeatable methodology.
48. Scrap Management and Sustainability
Reducing scrap can also produce environmental benefits.
Less purchased steel for the same approved output can mean:
- less upstream material demand;
- lower inbound freight;
- less internal handling;
- lower recycling transport requirements;
- lower processing demand.
Recycling remains extremely important.
But from a resource-efficiency perspective, preventing unnecessary material consumption can preserve more value than recycling material after avoidable waste has already occurred.
The hierarchy should therefore be:
Prevent → Reduce → Reuse → Segregate → Recover → Recycle
49. From Scrap Management to Continuous Material Optimization
A mature company eventually stops treating scrap reduction as a temporary project.
It develops a technical database connecting:
Product → Steel → Supplier → Thickness → Width → Sheet/Coil → Nesting → Machine → Process → Yield → Scrap → Cost
This knowledge can support:
- purchasing negotiations;
- supplier development;
- product redesign;
- process improvement;
- steel-grade optimization;
- inventory reduction;
- thickness optimization;
- lightweighting projects.
Scrap management becomes part of the company’s broader steel strategy.
50. Frequently Asked Questions
Is steel scrap always a manufacturing loss?
No. Some scrap is technically inherent to product geometry or the manufacturing process. The objective is to distinguish unavoidable scrap from technically and economically reducible losses.
What is the most important KPI for scrap management?
There is no single KPI. Material yield is an excellent starting point, but it should be complemented by scrap rate, scrap by cause, process stage, recovery value, and cost per approved finished product.
Is obtaining a higher scrap selling price a cost-reduction strategy?
It improves recovery, but it does not prevent the original material loss. Scrap reduction and scrap recovery should be managed separately.
Can changing sheet dimensions reduce scrap?
Yes. Purchased sheet dimensions can strongly affect nesting and material utilization.
Can changing coil width reduce scrap?
Yes. Continuous edge losses can become substantial in high-volume coil-fed processes.
Can thickness tolerance influence scrap cost?
Yes. Excess actual thickness increases purchased mass. The additional mass also increases the mass of geometrically generated scrap.
Should every remnant be stored?
No. Remnants should satisfy defined technical and economic criteria.
Can a more expensive steel supplier reduce total manufacturing cost?
Yes. Better dimensional consistency, flatness, surface quality, process behavior, or custom supply dimensions can improve material yield and reduce the cost per approved product.
Why should quality rejects be separated from cutting scrap?
Because their accumulated manufacturing costs can be very different. A final-product rejection may contain substantial processing cost beyond the original steel value.
What should be the ultimate KPI?
For many manufacturers, one of the strongest indicators is:
Steel Cost per Approved Finished Product
because it connects purchasing, material utilization, scrap, quality, and actual production output.
Conclusion: The Cheapest Scrap Is the Scrap That Was Never Generated
Steel scrap has commercial value.
But this should never obscure a more important economic reality:
A tonne of steel sold as scrap normally recovers only part of the economic value of the tonne originally purchased and processed.
Effective scrap management therefore begins before scrap exists.
It begins with:
Engineering → Purchasing → Material Specification → Product Design → Sheet and Coil Dimensions → Cutting and Nesting → Process Capability → Quality → Production Control
Only after technically and economically avoidable losses have been minimized should the company concentrate on maximizing recovery from unavoidable scrap.
The most advanced manufacturers should therefore stop asking only:
“How much scrap did we sell this month?”
and begin asking:
“How much of the steel we purchased became approved finished product, where did we lose the remainder, what was its true economic cost, and what can we change?”
That is the transition from scrap management to material yield management.
And material yield management transforms steel cost reduction from a purchasing exercise into an engineering-based competitive advantage.