
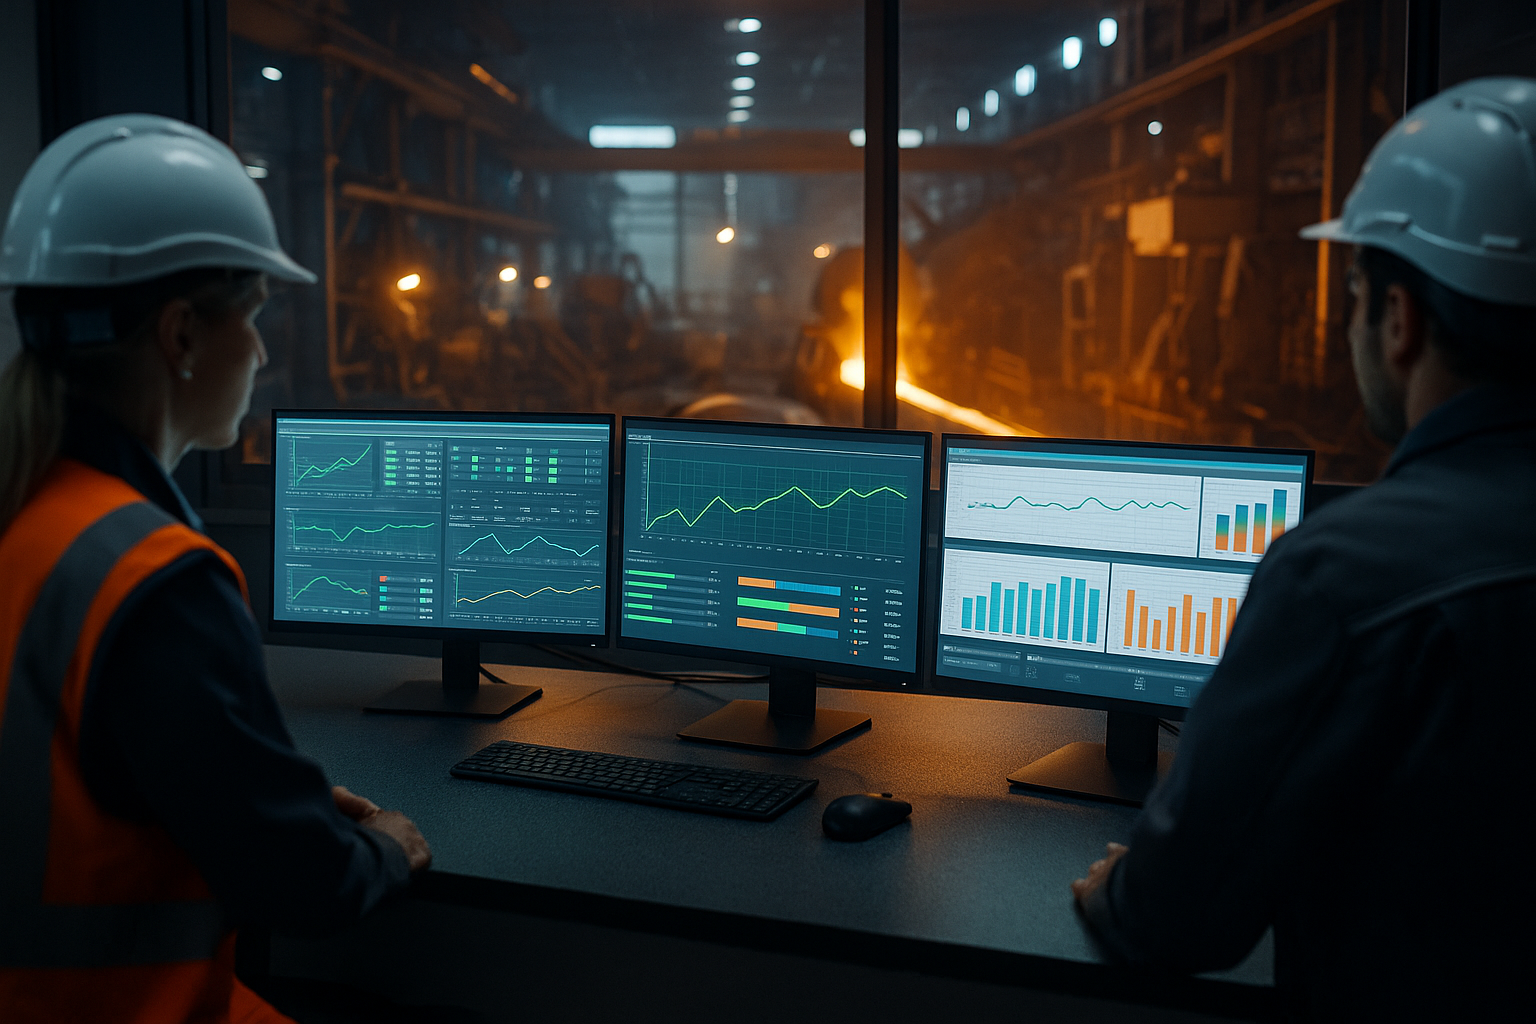
Steel production generates enormous volumes of operational data. Temperatures, pressures, flows, speeds, electrical loads, chemical measurements, equipment conditions, dimensional measurements, energy consumption and quality parameters continuously change as material moves through the production route.
Collecting these signals, however, is not the same as using them effectively.
A steel plant may have thousands of sensors and still struggle with delayed decisions, excessive alarms, disconnected databases, poor data quality and limited visibility across processes. Conversely, a well-designed monitoring architecture can transform selected process signals into timely information that operators, engineers and managers can use to improve stability, quality, energy performance and equipment reliability.
This is the real purpose of real-time data monitoring.
It is not simply a dashboard project. It is not synonymous with process automation, artificial intelligence or the Industrial Internet of Things.
Real-time monitoring is the engineering discipline of acquiring, validating, contextualizing, processing, presenting and retaining operational information with sufficient timeliness to support a defined decision.
The complete chain can be summarized as:
Physical Process → Measurement → Control System → Data Infrastructure → Context → Visualization / Analytics → Decision → Action
If any link in that chain is weak, more data does not necessarily produce better operations.
1. What Does “Real-Time” Actually Mean in a Steel Plant?
The expression real-time is often used loosely.
In engineering, it should be connected to the time requirement of a specific process or decision.
A high-speed rolling control loop may require measurements and responses within milliseconds. A furnace operator may need updated process information within seconds. Energy-management analysis may tolerate longer intervals. Production-management KPIs may only need to be refreshed every few minutes.
Therefore, there is no single universal definition such as:
Real-time = every second.
A better definition is:
Data is sufficiently real-time when its acquisition, processing and delivery occur within the time window required for the intended operational decision.
This distinction prevents unnecessary system complexity.
Not every variable needs high-frequency acquisition.
Sampling a slowly changing tank level thousands of times per second creates data volume without additional decision value.
Conversely, inadequate sampling of a rapidly changing process can hide important dynamics.
The correct data frequency depends on the physics of the process and the decision being supported.
2. Monitoring Is Not the Same as Control
This distinction is fundamental.
Monitoring
Monitoring tells the organization what is happening.
Examples include:
- displaying furnace temperature;
- trending rolling force;
- tracking motor current;
- showing cooling-water flow;
- displaying energy consumption;
- identifying an abnormal vibration trend.
Control
Control changes the process automatically or through operator intervention.
Examples include:
- adjusting fuel flow;
- changing roll gap;
- modifying cooling-water flow;
- regulating motor speed;
- controlling mold level.
A control loop may use real-time measurements, but the existence of real-time data does not mean that the process is automatically controlled.
This boundary is important because it separates this article from our guide to process automation in steel production.
Automation focuses primarily on how systems execute control actions.
Real-time monitoring focuses on how operational information becomes visible, interpretable and actionable.
3. The Industrial Data Architecture
A modern steel plant typically contains multiple layers of operational technology.
A simplified architecture is:
Physical Process → Sensors / Instruments → PLC or DCS → HMI / SCADA → Historian → MES / Analytics → Enterprise Systems
Each layer performs a different function.
Sensors and instruments
These measure physical variables such as:
- temperature;
- pressure;
- flow;
- level;
- speed;
- position;
- force;
- vibration;
- current;
- voltage;
- chemical composition;
- thickness;
- dimensional characteristics.
Sensors are the interface between the physical process and the digital system.
For a deeper discussion, see How Smart Sensors Are Enhancing Process Control in Steel Plants.
PLCs
Programmable Logic Controllers execute deterministic logic for machines and production systems.
They commonly handle:
- interlocks;
- sequences;
- machine states;
- digital and analog I/O;
- alarms;
- local control functions.
DCS
Distributed Control Systems are commonly associated with continuous or complex process control.
Depending on plant architecture, they may manage multiple process areas and control loops.
HMI
Human-Machine Interfaces present process information to operators and allow authorized interaction with the control system.
SCADA
Supervisory Control and Data Acquisition systems provide supervisory visibility, alarms, trends and control capabilities across processes or distributed assets.
Historian
The process historian stores time-series operational data.
This is one of the most important elements in industrial analytics because it allows engineers to compare current conditions with historical behavior.
MES
Manufacturing Execution Systems connect shop-floor information with production execution.
Depending on implementation, MES may manage or contextualize:
- production orders;
- material genealogy;
- process routes;
- product status;
- quality results;
- production reporting;
- downtime;
- and performance indicators.
These systems should not be treated as interchangeable.
A historian is not a PLC.
A dashboard is not a SCADA system.
MES is not simply long-term data storage.
Understanding these boundaries is essential when designing a reliable monitoring architecture.
4. From Raw Signal to Useful Information
A sensor value by itself has limited meaning.
Suppose a dashboard displays:
Motor current = 420 A
Is that normal?
The answer depends on context.
Engineers may need to know:
- which motor;
- operating speed;
- production load;
- steel grade;
- product dimensions;
- operating mode;
- previous current profile;
- maintenance condition;
- time since startup.
This leads to one of the most important principles of industrial data systems:
Data becomes more valuable when it is contextualized.
A useful record should ideally connect the measurement to relevant information such as:
Timestamp + Asset + Process State + Product + Operating Condition + Engineering Unit + Quality Status
Without context, a plant can accumulate billions of data points while still struggling to answer basic engineering questions.
5. Data Quality Comes Before Advanced Analytics
A sophisticated dashboard or AI model cannot compensate for unreliable measurement.
Industrial data quality problems can include:
- sensor drift;
- calibration errors;
- failed instruments;
- frozen values;
- missing data;
- duplicated timestamps;
- incorrect engineering units;
- communication interruptions;
- inconsistent equipment naming;
- manual-entry errors;
- clock synchronization problems;
- sensor replacement without documentation.
Consider a temperature sensor that gradually drifts upward.
A monitoring system may interpret the signal as process deterioration even though the process itself has not changed.
Or imagine two systems using different tags for the same asset.
Analytics may treat them as separate equipment.
Before investing heavily in AI, organizations should establish strong practices for:
- instrumentation;
- calibration;
- tag management;
- timestamp synchronization;
- metadata;
- validation;
- data ownership;
- and change management.
Data governance is an engineering requirement.
6. Sampling Rate, Refresh Rate and Latency Are Different
These terms are often confused.
Sampling rate
How frequently the physical signal is measured.
Processing interval
How frequently data is calculated, aggregated or transformed.
Refresh rate
How frequently the displayed information is updated.
Latency
The delay between the physical event and the moment when information becomes available to the user or application.
A sensor may sample rapidly while a dashboard refreshes much more slowly.
That is not necessarily a problem.
The correct architecture depends on the use case.
For high-speed control, very low latency may be essential.
For plant-management dashboards, excessive update frequency may simply make information difficult to interpret.
7. Why Historical Context Matters to Real-Time Decisions
Real-time data without history answers:
What is happening now?
Historical data helps answer:
Is this normal?
and:
How did we get here?
This is why historians and trend analysis remain essential.
An operator seeing furnace pressure at a particular value may need to know whether it:
- has been stable;
- changed abruptly;
- has been drifting for hours;
- follows a recurring production pattern.
Current value + historical trend is often far more useful than either alone.
This also provides the foundation for more advanced analytics.
8. Alarm Management: More Alarms Do Not Mean More Control
Real-time systems can generate enormous numbers of alarms.
Poorly designed alarm systems create:
- alarm floods;
- nuisance alarms;
- duplicate alarms;
- low-priority distractions;
- operator desensitization.
This is dangerous because critical information can disappear within noise.
A useful alarm should answer:
What happened?
How important is it?
What should the operator consider doing?
Alarm design should therefore consider:
- priority;
- consequence;
- response time;
- persistence;
- suppression logic;
- operating state;
- ownership.
The objective is not maximum alarm quantity.
It is maximum actionability.
9. Real-Time Monitoring Across the Steel Production Route
The most valuable variables depend on the process.
Raw Material Handling
Possible monitoring points include:
- conveyor speed;
- motor current;
- belt status;
- bin level;
- material flow;
- weighing systems;
- equipment availability.
These data help operators identify flow restrictions, equipment problems and material-supply interruptions.
10. Ironmaking
Ironmaking processes involve interacting thermal, chemical and fluid variables.
Monitoring may include:
- temperatures;
- pressures;
- gas composition;
- flow rates;
- cooling conditions;
- burden-related information;
- auxiliary-equipment status.
The objective is not simply to display variables but to understand process stability and detect deviations early.
11. Electric Arc Furnace Operations
EAF monitoring may integrate:
- electrical power;
- electrode behavior;
- current and voltage;
- oxygen and gas flows;
- cooling-water parameters;
- furnace status;
- tapping information;
- energy consumption.
Different signals operate at different time scales.
High-frequency electrical data may serve one engineering purpose, while heat-level energy KPIs serve another.
A single “real-time dashboard” should not attempt to treat every variable identically.
12. Secondary Metallurgy
Ladle furnace and refining operations may monitor:
- temperature;
- power;
- stirring conditions;
- process time;
- additions;
- equipment status.
Integration with heat identification and production context is particularly important because measurements must remain connected to the correct batch.
13. Continuous Casting
Continuous casting is one of the strongest applications for integrated real-time monitoring.
Relevant variables may include:
- mold level;
- casting speed;
- cooling-water conditions;
- spray-zone parameters;
- temperatures;
- oscillation-related information;
- equipment status;
- process alarms.
The engineering challenge is not merely displaying these signals independently.
Their interactions matter.
An abnormal condition can arise from combinations of variables that individually remain within acceptable ranges.
14. Hot Rolling
Hot rolling generates large volumes of high-speed process data.
Typical variables include:
- rolling force;
- torque;
- speed;
- roll gap;
- strip thickness;
- temperature;
- cooling parameters;
- motor current;
- tension;
- dimensional measurements.
Real-time monitoring can support faster identification of deviations and provide the data foundation for process control and quality analysis.
For dimensional control, this connects directly with our discussion of steel thickness tolerances and manufacturing control.
15. Cold Rolling and Finishing
Monitoring may include:
- strip tension;
- speed;
- thickness;
- flatness;
- surface inspection;
- motor load;
- line status;
- coating parameters;
- quality measurements.
The combination of process and quality data is particularly important.
A dimensional or surface defect becomes more useful diagnostically when engineers can trace it back to the operating conditions under which it was produced.
16. Energy and Utilities
Steel production is energy intensive, making utilities an important monitoring domain.
Relevant information may include:
- electricity demand;
- natural-gas consumption;
- compressed air;
- steam;
- oxygen;
- industrial gases;
- cooling water;
- pump performance.
The best energy dashboards normalize consumption against meaningful production conditions.
Simply displaying total MWh does not reveal whether energy performance improved.
Useful metrics may include:
Energy per tonne
or energy intensity by:
- process;
- product;
- heat;
- shift;
- operating state.
17. Environmental Monitoring
Environmental data can include:
- emissions;
- water parameters;
- wastewater conditions;
- dust-collection performance;
- gas flows;
- energy-related emissions indicators.
However, operational monitoring and regulatory compliance should not be treated as automatically equivalent.
Compliance measurements may require specific approved instrumentation, methods, calibration, reporting and regulatory procedures.
A production dashboard should therefore not be assumed to replace legally required environmental monitoring systems.
18. Real-Time Quality Monitoring
Quality data creates value when connected to the process history of the material.
For example:
Coil → Heat → Slab → Process Conditions → Dimensional Measurements → Surface Inspection → Final Quality Result
This traceability allows engineers to investigate relationships between process conditions and defects.
Potential applications include:
- thickness control;
- width;
- flatness;
- surface inspection;
- temperature history;
- chemistry;
- mechanical-test results.
This creates a bridge between operational monitoring and quality engineering.
19. Real-Time Monitoring and Predictive Maintenance
Equipment-condition information can be part of a real-time monitoring architecture.
Examples include:
- vibration;
- bearing temperature;
- motor current;
- lubricant condition;
- pressure;
- flow.
But displaying equipment data does not automatically constitute predictive maintenance.
Predictive maintenance requires a reliability workflow that connects condition information with failure modes, diagnosis and maintenance decisions.
That distinction is covered in detail in our Predictive Maintenance in Steel Plants: A Practical Engineering Guide to Equipment Reliability.
The relationship is:
Real-Time Monitoring → provides information
Predictive Maintenance → uses relevant condition information to support maintenance decisions
20. Edge Computing
Sending every raw signal to a central cloud platform is not always practical.
High-frequency industrial signals can generate substantial data volumes.
Edge computing places processing closer to the equipment.
Potential functions include:
- filtering;
- aggregation;
- event detection;
- local analytics;
- protocol conversion;
- data compression.
Edge architectures may also help maintain selected functionality when higher-level connectivity is unavailable.
However, edge computing should not be confused with automatic control.
Safety-critical and deterministic control functions require architectures appropriate to their performance and safety requirements.
21. Cloud Analytics: Useful, but Not for Everything
Cloud platforms can provide value for:
- multi-plant comparisons;
- enterprise analytics;
- long-term storage;
- model development;
- fleet-level analysis;
- management reporting.
But not every steelmaking function belongs in the cloud.
Factors include:
- latency;
- availability;
- cybersecurity;
- data volume;
- connectivity;
- operational criticality.
A sensible architecture may therefore combine:
Local Control + Edge Processing + Plant-Level Systems + Selective Cloud Services
rather than forcing all data into one platform.
22. Dashboards Should Support Decisions, Not Decoration
An effective dashboard is designed around a user and a decision.
An operator needs different information from:
- a maintenance engineer;
- a process engineer;
- a production manager;
- an energy manager;
- an executive.
Common dashboard design failures include:
- too many KPIs;
- excessive colors;
- unnecessary gauges;
- lack of historical context;
- no indication of target or limit;
- unclear units;
- mixing different time scales;
- presenting information without an expected response.
A useful question is:
If this value changes, what decision should the user make?
If there is no clear answer, the metric may not belong on the operational dashboard.
23. KPIs Need Context
KPIs such as:
- throughput;
- yield;
- OEE;
- energy intensity;
- downtime;
- reject rate;
- production rate;
- maintenance indicators
can support decision-making.
But KPIs can mislead when their denominator or operating context changes.
For example, comparing energy per tonne between periods without considering product mix may produce incorrect conclusions.
Real-time systems should therefore support contextualized KPIs, not merely faster KPIs.
24. The Role of AI and Machine Learning
AI can extend monitoring by identifying relationships and anomalies that conventional thresholds may miss.
Potential applications include:
- anomaly detection;
- multivariable pattern recognition;
- quality prediction;
- energy optimization;
- equipment-condition assessment;
- process-state classification.
But AI should not become a substitute for reliable instrumentation and process knowledge.
NIST’s 2026 smart-manufacturing roadmap highlights continuing challenges involving industrial big data, data management, heterogeneous sensing and control systems, and trustworthy and explainable AI.
The practical sequence should usually be:
Reliable Measurement → Structured Data → Context → Engineering Understanding → Analytics → AI where justified
not:
AI first → search for usable data later.
For a deeper treatment, see AI in Steel Manufacturing: Optimizing Steel Plant Operations.
25. OT/IT Integration
Operational Technology and Information Technology increasingly exchange information.
OT includes systems directly associated with industrial operation, such as:
- PLCs;
- DCS;
- SCADA;
- HMIs;
- industrial networks.
IT includes enterprise computing environments such as:
- business applications;
- databases;
- corporate networks;
- analytics platforms.
Integration can create significant value.
But connectivity should be deliberate.
The objective is not to make every PLC directly accessible to every enterprise application.
A robust architecture controls:
- data flows;
- access;
- authentication;
- network boundaries;
- system ownership.
26. Cybersecurity Is Part of Monitoring Architecture
Greater connectivity increases the cyberattack surface.
NIST emphasizes that as OT and ICS environments become more interconnected with IT networks, manufacturing operations face increasing cyber risk with potential consequences for operations, safety and property.
CISA likewise identifies SCADA, PLCs, HMIs and other industrial control components as cybersecurity-relevant systems in critical manufacturing.
Real-time monitoring architecture should therefore consider:
- network segmentation;
- asset inventory;
- identity and access management;
- secure remote access;
- patch management;
- logging;
- backups;
- recovery planning;
- vendor access;
- exposure reduction.
CISA specifically recommends reducing unnecessary internet exposure of IIoT, SCADA and ICS assets.
Cybersecurity cannot be an afterthought added once the plant is fully connected.
27. What Happens When Monitoring Systems Fail?
Monitoring infrastructure can fail too.
Potential problems include:
- sensor failure;
- network interruption;
- historian outage;
- server failure;
- database corruption;
- cloud unavailability;
- cyber incident.
Therefore, the architecture should define:
- redundancy where justified;
- local fallback;
- data buffering;
- recovery procedures;
- backup;
- degraded operating modes.
A particularly important principle is:
Loss of a dashboard should not automatically mean loss of safe process control.
Monitoring, supervisory control and safety functions must be architected according to their respective criticality.
28. Common Implementation Mistakes
Connecting everything before defining the use case
This creates enormous datasets without clear operational value.
Treating every variable as real-time
Different processes require different time scales.
Building dashboards before understanding users
A beautiful dashboard can still be operationally useless.
Ignoring instrumentation quality
Poor sensors create poor decisions.
No historian strategy
Current values without historical context limit engineering analysis.
Alarm overload
Excessive alarms reduce operator effectiveness.
Poor tag governance
Inconsistent naming makes system integration and analytics difficult.
Ignoring legacy equipment
Older assets may require gateways, retrofit sensors or alternative integration strategies.
Treating cloud as mandatory
Some functions belong locally.
Treating AI as the starting point
Advanced analytics should be built on reliable industrial data.
Neglecting cybersecurity
More connectivity without appropriate architecture can increase operational risk.
29. A Practical Implementation Roadmap
A disciplined monitoring project can follow these stages.
Step 1 — Define the operational decision
What problem should better information solve?
Examples:
- quality deviation;
- excessive energy consumption;
- production bottleneck;
- equipment deterioration;
- unstable process condition.
Step 2 — Identify critical variables
Select only variables relevant to that decision.
Step 3 — Verify instrumentation
Check:
- measurement accuracy;
- calibration;
- sensor location;
- reliability;
- sampling capability.
Step 4 — Map the data architecture
Identify:
Sensor → Controller → Network → SCADA → Historian → Analytics → User
Step 5 — Establish context
Connect signals with assets, products, batches, process states and timestamps.
Step 6 — Define timing requirements
Determine required:
- sampling;
- latency;
- refresh;
- retention.
Step 7 — Design alarms and visualization
Define who needs what information and what response is expected.
Step 8 — Integrate historical data
Provide trends and comparison with normal behavior.
Step 9 — Define cybersecurity controls
Address connectivity and access before scaling.
Step 10 — Measure operational value
Determine whether the monitoring system actually improved:
- response time;
- quality;
- downtime;
- yield;
- energy;
- reliability;
- decision quality.
Step 11 — Scale selectively
Expand proven use cases instead of simply connecting more devices.
30. How to Measure the Value of Real-Time Monitoring
Monitoring value should be connected to operational outcomes.
Possible indicators include:
- deviation detection time;
- operator response time;
- alarm frequency;
- actionable-alarm percentage;
- process variability;
- reject rate;
- yield;
- downtime;
- energy intensity;
- production interruptions;
- time required for root-cause analysis.
But attribution matters.
If yield improves after a dashboard is installed, the dashboard should not automatically receive full credit.
Process changes, maintenance, operator practices or product mix may also have contributed.
A credible business case distinguishes correlation from causation.
31. From Monitoring to Operational Intelligence
Real-time monitoring becomes more valuable as the organization progresses through several levels:
Visibility — What is happening?
Context — Under what conditions is it happening?
Diagnosis — Why is it happening?
Prediction — What is likely to happen next?
Optimization — What operating decision should be made?
This progression explains why data infrastructure matters.
AI, digital twins and advanced optimization depend on reliable lower layers.
An organization that cannot trust its tags, timestamps or sensors is not ready to rely heavily on autonomous recommendations.
32. Final Perspective
The competitive advantage of real-time monitoring does not come from collecting the largest possible volume of data.
It comes from delivering the right information, with the right context, within the right decision window, to the right user.
For steel plants, this requires integration across:
Process Physics → Instrumentation → Control Systems → Industrial Networks → Historian → Contextualization → Analytics → Human Decision → Operational Action
The most successful projects begin with an operational problem rather than a technology.
They ask:
- What decision needs to improve?
- Which variables describe the problem?
- How quickly must the information arrive?
- Can the measurements be trusted?
- Who will act on the information?
- What happens if the monitoring system becomes unavailable?
- How will improvement be measured?
Only after these questions are answered should the plant decide how much IIoT, edge computing, cloud infrastructure or artificial intelligence it actually needs.
Real-time monitoring is therefore not simply about making steel plants more digital.
It is about making industrial decisions more timely, contextualized and technically reliable.
Frequently Asked Questions
What is real-time data monitoring in a steel plant?
It is the timely acquisition, processing, contextualization and presentation of operational information so that operators, engineers or automated systems can make decisions within the required process time window.
Does real-time mean that every signal must update every second?
No. The required frequency depends on the physics of the process and the decision. Some control applications require millisecond-level response, while management KPIs may only need updates every few minutes.
What is the difference between SCADA and a historian?
SCADA primarily supports supervisory monitoring, visualization, alarms and control. A historian is specialized in storing and retrieving time-series process data for trends, analysis and operational history.
Is MES the same as SCADA?
No. MES typically manages production-execution information such as orders, material genealogy, production status and quality context, while SCADA focuses more directly on supervisory process monitoring and control.
Can real-time monitoring improve steel quality?
Yes, when relevant process and quality variables are measured reliably and operators or control systems can respond within a useful time window. Monitoring alone, however, does not guarantee quality improvement.
Does real-time monitoring replace predictive maintenance?
No. It can provide equipment-condition data, but predictive maintenance additionally requires failure-mode analysis, diagnosis and a maintenance decision workflow.
Does every steel plant need cloud-based monitoring?
No. Local, edge, plant-level and cloud systems each have appropriate applications. Architecture should depend on latency, reliability, cybersecurity, data volume and operational requirements.
Can AI analyze real-time steelmaking data?
Yes. AI can support anomaly detection, prediction and optimization, but its effectiveness depends on data quality, context and engineering validation.
What is the biggest mistake when implementing real-time monitoring?
Starting with technology instead of the operational decision. Connecting thousands of signals without defining how the information will be used can create data overload rather than operational improvement.
Why is cybersecurity important for real-time monitoring?
Because greater connectivity between sensors, industrial control systems and enterprise networks increases the potential cyberattack surface. Monitoring architecture must therefore include appropriate segmentation, access control, secure connectivity and recovery planning.
Technical References
NIST — 2026 Roadmap on Artificial Intelligence and Machine Learning for Smart Manufacturing
Industrial data, sensing, heterogeneous control systems, trustworthy AI and advanced manufacturing analytics.
NIST — 2026 AI/ML Smart Manufacturing Roadmap
NIST NCCoE — Responding to and Recovering from a Cyber Attack: Cybersecurity for the Manufacturing Sector (NIST SP 1800-41, Initial Public Draft, 2026)
Cybersecurity resilience, response and recovery for manufacturing and ICS environments.
NIST — Manufacturing Cybersecurity and Recovery
CISA — Industrial Control Systems Recommended Practices
Cybersecurity guidance covering industrial control systems and defense-in-depth practices.
CISA — ICS Recommended Practices
CISA — Critical Manufacturing Sector Landscape
ICS, automation, connectivity and cybersecurity considerations for critical manufacturing.
CISA — Critical Manufacturing Sector Landscape
CISA — Internet Exposure Reduction Guidance
Guidance addressing internet-accessible IIoT, SCADA, ICS and remote-access systems.
CISA — Internet Exposure Reduction Guidance